Monday, June 26, 2023

Placebo Effect versus Nocebo Effect

In placebo-controlled clinical trials, a placebo refers to an inactive or inert substance or treatment that has no specific therapeutic effect on a person's health condition but is given or administered with the intention of maintaining the blinding of the study (i.e., the participants and/or investigators do not know if the active treatment or placebo is given). Placebo can be in the form of a pill (sugar pill), injection, or any other treatment method that resembles a real medical intervention. However, during the clinical trial, the placebo may have a therapeutic effect and have an impact on the outcome measures. 

The placebo effect is defined as a beneficial effect experienced by a clinical trial participant due to receiving a placebo (inactive substance) believing it to be an active treatment. The placebo effect has been discussed quite extensively in the literature. The Placebo Effect can come from psychological factors (the act of physically taking a pill may elicit a positive response) and neurobiological factors. (increased levels of “feel-good” neurotransmitters, like endorphins and dopamine). 

I posted several articles to discuss the placebo effect in placebo-controlled clinical trials. 
Now there is a term 'nocebo effect' (it is not a typo). In a newly released draft guidance by FDA "Psychedelic Drugs: Considerations for Clinical Investigations", the 'nocebo effect' is specifically mentioned: 
An AWC study uses a design that permits a valid comparison with a control to provide a quantitative assessment of a drug’s effect. In the context of psychedelic drug development, the use of a traditional placebo as a control can be problematic for assessing efficacy. Subjects receiving an active drug experience functional unblinding because of the intense perceptual disturbances that can develop; those who receive a placebo in the context of high expectancy may experience a nocebo effect (i.e., worsening symptoms as a result of knowing they did not get active treatment). However, an inactive control allows for better contextualization of any safety findings. Alternatives to an inert placebo (e.g., subperceptual doses of a psychedelic drug, other psychoactive drugs that mimic some aspects of the psychedelic experience) may be considered as well. 
The nocebo effect is defined as a negative effect experienced by a clinical trial participant due to receiving a placebo (inactive substance) believing it to be a harmful treatment. With the help of the ChatGPT, the following table compared the differences between the placebo effect and the nocebo effect. 

Aspect

Placebo Effect                                                

Nocebo Effect

Definition             

A positive response to an inactive treatment, often due to the person's belief in the treatment's effectiveness.

A negative response to a treatment, often due to the person's belief that the treatment will cause harm or have adverse effects.

Psychological Mechanisms

Expectation of improvement, conditioning, and the power of suggestion.

Expectation of harm, conditioning, and the power of suggestion.

Potential Chemical Mechanisms

Belief and expectation trigger the release of endorphins, dopamine, and other neurochemicals, leading to perceived improvement in symptoms.

Belief and expectation trigger the release of stress hormones (e.g., cortisol) and activate the brain’s pain pathways, leading to perceived worsening of symptoms.

Common Occurrences

In clinical trials, as a control group receiving an inactive treatment (e.g., sugar pill).

In clinical trials, when participants experience side effects despite receiving an inactive treatment, or when they're informed about potential side effects

Impact on Treatment

Can lead to an actual improvement in symptoms or a perceived improvement in well-being

Can cause or exacerbate symptoms, leading to a perceived worsening of health

Importance in Research

Helps determine the true efficacy of a treatment by comparing it to the placebo group

Highlights the importance of considering participants' expectations and beliefs when designing and interpreting clinical trials.

Clinical Use

Utilized in clinical trials as a control to assess the effectiveness of new treatments.

Considered a challenge in clinical trials as it can lead to false negative outcomes or increased reports of adverse effects.

Impact on Clinical Trial Outcome

Making the outcome measures in placebo group artificially better than what they should be.

Underestimating the treatment difference. Lowering the statistical power.

Making the outcome measures in placebo group artificially worse than what they should be.

On the efficacy side, overestimate the treatment difference. Increasing the statistical power.

Ethical Considerations

May be considered deceptive if participants are not informed about the possibility of receiving a placebo

Raises questions about the balance between informing participants of potential side effects and avoiding the creation of negative expectations

Examples

- Feeling relief from pain after taking a sugar pill, believing it to be a painkiller.

- Experiencing reduced anxiety after receiving a fake treatment, thinking it is an anti-anxiety medication.

- Developing side effects (e.g., nausea, dizziness) after taking a harmless sugar pill, convinced it is a potent medication.

- Perceiving worsening of symptoms despite receiving an inert substance, assuming it is a harmful treatment.

References: 


Wednesday, June 21, 2023

SAE reporting - from non-serious AE to serious AE - one event or two events?

An adverse event is any undesirable experience associated with the use of a medical product in a patient. The event is serious (therefore serious adverse event (SAE)) and should be reported when the patient outcome is:

Death

Report if you suspect that the death was an outcome of the adverse event, and include the date if known. 

Life-threatening

Report if suspected that the patient was at substantial risk of dying at the time of the adverse event, or use or continued use of the device or other medical product might have resulted in the death of the patient.

Hospitalization (initial or prolonged)

Report if admission to the hospital or prolongation of hospitalization was a result of the adverse event.

Emergency room visits that do not result in admission to the hospital should be evaluated for one of the other serious outcomes (e.g., life-threatening; required intervention to prevent permanent impairment or damage; other serious medically important event).

Disability or Permanent Damage

Report if the adverse event resulted in a substantial disruption of a person's ability to conduct normal life functions, i.e., the adverse event resulted in a significant, persistent or permanent change, impairment, damage or disruption in the patient's body function/structure, physical activities and/or quality of life.

Congenital Anomaly/Birth Defect

Report if you suspect that exposure to a medical product prior to conception or during pregnancy may have resulted in an adverse outcome in the child.

Required Intervention to Prevent Permanent Impairment or Damage (Devices)

Report if you believe that medical or surgical intervention was necessary to preclude permanent impairment of a body function, or prevent permanent damage to a body structure, either situation suspected to be due to the use of a medical product.

Other Serious (Important Medical Events)

Report when the event does not fit the other outcomes, but the event may jeopardize the patient and may require medical or surgical intervention (treatment) to prevent one of the other outcomes. Examples include allergic brochospasm (a serious problem with breathing) requiring treatment in an emergency room, serious blood dyscrasias (blood disorders) or seizures/convulsions that do not result in hospitalization. The development of drug dependence or drug abuse would also be examples of important medical events.

In clinical trial setting, there are two layers of SAE reporting:

The investigational site reports the SAE to the trial sponsor:

According to ICH E6 (Good Clinical Practice), the SAEs should be reported immediately to the sponsor when the site staff become aware of the occurrence of a SAE. 'Reported immediately' is generally interpreted as 'reported within 24 hours'. The clinical trial protocol typically includes a statement "Sites must report SAE information regardless of causality or expectedness to the Sponsor within 24 hours of awareness of an SAE." 


The sponsor or designee reports the SAEs and SUSAR to the regulatory authorities (FDA):

SAEs need to be reported to regulatory agencies and IRBs/ECs in narrative format (so called SAE narratives). According to 21CRF part 312.32 Safety Reporting, here are the requirements:


SUSUR stands for serious and unexpected suspected adverse reaction. FDA guidance "Safety Reporting Requirements for INDs and BA/BE Studies" provided the definition for SUSAR and specified the reporting requirement. 


SUSAR determination and subsequent reporting are typically handled by the drug safety or pharmacovigilance group, which has access to treatment assignment information. When a SUSAR event is reported, the drug safety or pharmacovigilance group may unblind the individual subject to determine if they are in the active drug group or the placebo group. If the subject is in the placebo group, it will not be considered a SUSAR.

SUSAR events that involve unexpected fatal or life-threatening suspected adverse reactions must be reported to the FDA within 7 days through the submission of a "7-day IND safety report." Here is what is said in 21CFR part 312.32 IND Safety Reporting:


In practice, it is common for adverse events to initially present as non-serious (not meeting the criteria for defining a serious adverse event), but with the event worsening, they may evolve into a serious adverse event. For example, a subject may experience an adverse event that eventually requires hospitalization, meeting the criteria for a serious adverse event.

There is a common (but inappropriate) approach to handling this situation by splitting the event into two separate entries: one for the initial non-serious adverse event and another for the subsequent serious adverse event. Some sponsors provide instructions to record the non-serious adverse event with a stop date, mark the outcome as 'Not recovered/not resolved,' and create a new entry for the serious adverse event with the start date when the seriousness criteria are met. The stop date of the non-serious adverse event should be the same date or the day prior to the start date of the serious adverse event. While this approach aligns with SAE reporting and is considered conservative, it artificially divides the same episode into two separate events, which will cause the problem when writing the SAE narratives. We can not just write a SAE narrative without including the non-serious part - they are essentially the same event. 

In general, when an adverse event initially presents with non-serious symptoms and later progresses to meet the criteria for a serious adverse event (SAE), it is typically reported once as an SAE. This is because the serious adverse event designation takes precedence over the non-serious symptoms.

It's important to note that the onset date of the SAE should be the date when the symptoms started, not the date when the SAE criteria are met. Reporting of SAEs should be based on the date when the SAE criteria are met and when the site staff becomes aware of the SAE.

In situations where an adverse event starts as non-serious and progresses to serious, it is appropriate to report the event as an SAE.

When an adverse event evolves into a serious condition, such as requiring hospitalization or meeting other predefined criteria for seriousness, it is considered a new phase or stage of the same event. Reporting it as an SAE captures the escalated severity and ensures appropriate attention, monitoring, and reporting to regulatory authorities.


When an adverse event (AE) starts as non-serious and progresses to a serious state, it should be reported solely as a serious adverse event (SAE). In this situation, there are three potentially relevant dates: the "serious adverse event start date," "adverse event becomes serious," and "the site staff became aware of the serious adverse event." These terms are associated with the reporting and monitoring of adverse events in clinical trials or medical research. Here's a comparison of these terms:

Serious Adverse Event Start Date: The serious adverse event start date refers to the specific date when an adverse event initially occurred or began in a participant during a clinical trial or medical research study. It marks the beginning of the event's timeline and is often recorded to establish the temporal relationship between the event and the study procedures.

Adverse Event Becomes Serious: An adverse event refers to any unfavorable or undesirable medical occurrence experienced by a participant during a clinical trial or medical research study, regardless of its seriousness. When an adverse event becomes serious, it means that the event has worsened in intensity, severity, or clinical impact. The criteria for determining whether an adverse event is considered serious may vary, but they generally include outcomes such as death, life-threatening situations, hospitalization or prolonged hospital stay, significant disability, congenital anomalies, or other important medical events.

The Site Staff Became Aware of the Serious Adverse Event: This phrase signifies the point at which the staff at the clinical trial site or research facility becomes aware of the occurrence of a serious adverse event in a participant. It is crucial to promptly report and document the event to ensure participant safety and adhere to regulatory requirements. The site staff's awareness triggers subsequent actions such as assessment, documentation, reporting to the appropriate authorities, and potential modifications to the study protocol or participant management.

In summary, when an adverse event starts as non-serious and progresses to a serious state, it should be reported solely as a serious adverse event (SAE). The serious adverse event start date marks the initial occurrence of the event, while the "adverse event becomes serious" indicates the worsening of its intensity or impact. The "site staff became aware of the serious adverse event" signifies the point when the research facility staff acknowledges the occurrence and initiates the necessary actions for reporting and participant safety.

Saturday, June 17, 2023

Regulatory Education for Industry (REdI) Annual Conference 2023 - Slides and Recordings

Early this month, FDA conducted 'Regulatory Education for Industry (REdl) Annual Conference 2023'. This annual conference provided opportunity for health care industry professionals to Learn directly from the FDA’s regulatory experts in medical product centers: drugs, devices, and biologics. The course from annual conference is designed to provide participants with a strong, basic foundation in the FDA’s regulatory requirements, and also create awareness of current activities.

All the FDA presentation can be watched on Youtube and the presentation slides are listed in the tables. 

There are two presentations by FDA statisticians: Dr Andrew Potter on "Reviewer’s Perspective on Data Collected by Wearable Digital Health Technology in Clinical Trials" and Dr John Scott on "FDA’s Implementation of the Estimand Framework and Complex Innovative Trial Design Meeting Program".

Plenary + Drugs Day 1:


Drugs Day 2: 

Leveraging Small Business and Industry Assistance (SBIA) Resources

Renu Lal

Overview of FDA Split Real Time Application Review (STAR) Pilot Program

LaShawn Schnupp

Use-Related Risk Analysis (URRA) and Human Factors (HF) Protocol Reviews: What to Submit for an Efficient Review

Lolita Sterrett

The Modernization of Clinical Trials through Digital Health Technologies (DHTs), Decentralized Clinical Trials (DCTs), and Point of Care Trials

Elizabeth Kunkoski

PDUFA VII Real-World Evidence

Kimberly A. Smith

New PDUFA VII Commitments: Pre-approval & Post-approval Postmarketing Requirements (PMRs)

Kathleen Weil

How CDER is Accelerating Rare Disease Cures and the PDUFA VII Rare Disease Endpoints Advancement Pilot Program

Kerry Jo Lee

Chemistry, Manufacturing, and Controls Assessment for Expedited Programs

Paresma Patel

Best Practices for Drug Product Recalls

Doris Chin


Devices Day 1:


Devices Day 2/Biologics Day 1:

Design Considerations for Clinical Trials in Rare Diseases

Rosa Sherafat


Biologics Day 2:


Friday, June 02, 2023

Resubmission of NDA/BLA After CRL: Class 1 versus Class 2 resubmission

If new drug application (NDA) or biological license application (BLA) is not approved by the FDA, the sponsor will receive a complete response letter (CRL). FDA's CRL letter will state something like "the application could not be approved at this time based on [issues and deficiencies]". Receiving a CRL is not the end of the world and the sponsor can address the issues and deficiencies and resubmit the NDA/BLA. Many NDA/BLAs were approved after the resubmission. 

It may take the sponsor months/years to address the issues and deficiencies before NDA/BLA can be resubmitted. However, once the NDA/BLA is resubmitted, the time leading to the PDUFA date is predicable. FDA's policy is to classify the resubmission into one of two classes: class 1 and class 2. 

Resubmission was discussed in 21 CFR Part 314.110 "Complete response letter to the applicant":  


FDA has a MAPP (Manual of Policies and Procedures) specifically about the classification of the NDA/BLA resubmission "Classifying Resubmissions of Original NDAs, BLAs, and Efficacy Supplements in Response to Complete Response Letters". The MAPP listed the items qualifying for class 1 and 2 resubmission.

The review time leading to the PDUFA date is 4 months longer for Class 2 than Class 1 resubmission. Four months seem to be short, but sometimes can be critical if there are competitive NDA/BLA submissions in the same therapeutic area. This is why there is a priority review designation and a priority review voucher program - both will shorten the FDA review time by 4 months. 

Here is an example of resubmission with Class 1 category and an example of resubmission with Class 2 category:

LIPOCINE ANNOUNCES ITS PARTNER RECEIVED FDA ACCEPTANCE OF NDA RESUBMISSION FOR TLANDO® 
"...announcing that the U.S. Food and Drug Administration (“FDA”) has accepted its New Drug Application (“NDA”) resubmission for TLANDO® (testosterone undecanoate). The FDA designated the NDA as a Class 1 resubmission with a two-month review goal period and set a target action date of March 28, 2022, under the Prescription Drug User Fee Act (PDUFA). Lipocine licensed the exclusive U.S. rights for TLANDO® to Antares Pharma."

Ardelyx Announces FDA Acceptance and Six-Month Review for Resubmission of its New Drug Application of XPHOZAH® (tenapanor)

"...the U.S. Food and Drug Administration (FDA) has accepted its resubmission of a New Drug Application (NDA) for XPHOZAH® (tenapanor) for the control of serum phosphate in adult patients with chronic kidney disease on dialysis who have had an inadequate response or intolerance to a phosphate binder therapy. The FDA has determined that the NDA is a class 2 review, which results in a six-month review period from the date of resubmission...."

Monday, May 29, 2023

Final FDA Guidance "Adjusting for Covariates in Randomized Clinical Trials for Drugs and Biological Products" - what we learned?

In May 2023, FDA published the final guidance for industry "Adjusting for Covariates in Randomized Clinical Trials for Drugs and Biological Products". This final version was based on the draft guidance with the same title that was released 4 years ago in April 2019 (see a previous post "FDA and EMA Guidance on Adjusting for Covariates in Randomized Clinical Trials".

FDA created guidance snapshot below:


The final guidance provided the general guidelines on several issues related to the covariates or baseline covariates. 


Both unadjusted analysis and analysis adjusted for baseline covariates are acceptable. However, if analysis is adjusted for baseline covariates, the details about the covariates need to be pre-specified in the statistical analysis plan before the study unblinding. Our experience is that the details about which baseline covariates to be included and whether the baseline covariates are continuous or categorized need to be pre-specified. 

Usually, the analysis adjusted for baseline covariates leads to efficiency gain and is more powerful than the unadjusted analysis. 

It is acceptable to calculate the sample size based on adjusted analysis, but perform the final analysis based on analysis adjusted for baseline covariates. In practice, the sample size calculation is commonly based on adjusted analysis regardless of the final analysis. For example, for a study to compare two group means, the sample size may be calculated based on t-test approach, but the analysis may be based on analysis of covariates where the adjustment for baseline covariates are used. 

For studies with stratified randomization where the randomization is stratified by one or more baseline covariates (categorical), the stratification factors are usually included in the analysis model even though the treatment assignments are generally balanced within each stratum. 

For studies with stratified randomization, it is not uncommon that incorrect stratification may occur where the treatment assignment is picked from the incorrect stratum. When this occurs, there will be two sets of the randomization stratification information (two different strata variables): strata as randomized versus actual strata. It is acceptable to use either strata variable as randomized (intention-to-treat principle) or actual strata variable (correct strata information for all patients). When mis-stratification occurs, there should be any attempt to go back to the randomization systems (such as IRT, IVR, IWR) to correct the stratification allocation. Once randomized, it is randomized. While the incorrect stratification is used for randomization, the correct stratification can be recorded on the case report form or EDC (electronic data capture). See a previous post "Handling Randomization Errors in Clinical Trials with Stratified Randomization".

For studies with continuous outcome measures, the endpoint is usually the change from baseline to a specific visit. Baseline covariate is used in the change from baseline calculation. In the analysis adjusted for baseline covariate, the baseline covariate can still be included in the model even though it gives an impression that the baseline measure is used twice. 

The guidance contains additional guidelines on linear models and non-linear models. For example, for linear models, the issue related to treatment group by covariate interactions is discussed: 


For non-linear models, binary outcome (logistic regression), ordinal outcome (generalized linear model), count outcome (Poisson regression), or time-to-event outcome (Cox regression) are analyzed. The estimators like odds ratio and hazard ratio are called are non-collapsible effect measures. Non-collapsibility implies that the effect parameter is not the same for different sets of covariates that are conditioned on, even if these covariates are independent of the exposure. Even when all subgroup treatment effects are identical, this subgroup specific conditional treatment effect can differ from the unconditional treatment effect. 


Sunday, May 21, 2023

Comparing assumptions for sample size estimation with the interim and final results

Sample size estimation is one of the critical aspects of the clinical trial design. The sample size estimation is usually based on the primary efficacy endpoint. If the primary efficacy endpoint measure is a continuous variable, the sample size estimation will need to be based on assumptions about the effect size (for example, the difference in means) and the common standard deviation If the primary efficacy endpoint measure is a rate and proportion, the sample size estimation will need to be based on the effect size (for example, the difference in responder rate) and the rate/proportion in the control group. 

Sometimes, the sample size estimations can be grossly inaccurate primarily because the assumptions used for the sample size calculation deviate from the observed data. This is especially true in planning pivotal studies with no or insufficient early-phase clinical trial data. 

It is important to check the assumptions for sample size estimation during the study and adjust the sample size when the observed data suggests the inaccuracy of these assumptions. The process is essentially the "Adaptations to the Sample Size" described in FDA's guidance "Adaptive Designs for Clinical Trials"

"Accumulating outcome data can provide a useful basis for trial adaptations. The analysis of outcome data without using treatment assignment is sometimes called pooled analysis. The most widely used category of adaptive design based on pooled outcome data involves sample size adaptations (sometimes called blinded sample size re-estimation). Sample size calculations in clinical trials depend on several factors: the desired significance level, the desired power, the assumed or targeted difference in outcome due to treatment assignment, and additional nuisance parameters—values that are not of primary interest but may affect the statistical comparisons. In trials with binary outcomes such as a response or an undesirable event, the probability of response or event in the control group is commonly considered a nuisance parameter. In trials with continuous outcomes such as symptom scores, the variance of the scores is a nuisance parameter. By using accumulating information about nuisance parameters, sample sizes can be adjusted according to prespecified algorithms to ensure the desired power is maintained. In some cases, these techniques involve statistical modeling to estimate the value of the nuisance parameter, because the parameter itself depends on knowledge of treatment assignment. These adaptations generally do not inflate the Type I error probability. However, there is the potential for limited Type I error probability inflation in trials incorporating hypothesis tests of non-inferiority or equivalence. Sponsors should evaluate the extent of inflation in these scenarios." 

 "One adaptive approach is to prospectively plan modifications to the sample size based on interim estimates of nuisance parameters from analyses that utilize treatment assignment information. For example, there are techniques that estimate the variance of a continuous outcome incorporating estimates of the variances on the individual treatment arms, or that estimate the probability of a binary outcome on the control arm based on only data from that arm. These approaches generally have no effect, or a limited effect, on the Type I error probability. However, unlike adaptations based on non-comparative pooled interim estimates of nuisance parameters, these adaptations involve treatment assignment information and, therefore, require additional steps to maintain trial integrity.
Another adaptive approach is to prospectively plan modifications to the sample size based on comparative interim results (i.e., interim estimates of the treatment effect). This is often called unblinded sample size adaptation or unblinded sample size re-estimation. Sample size determination depends on many factors, such as the event rate in the control arm or the variability of the primary outcome, the Type I error probability, the hypothesized treatment effect size, and the desired power to detect this effect size. In section IV., we described potential adaptations based on non-comparative interim results to address uncertainty at the design stage in the variability of the outcome or the event rate on the control arm. In contrast, designs with sample size adaptations based on comparative interim results might be used when there is considerable uncertainty about the true treatment effect size. Similar to a group sequential trial, a design with sample size adaptations based on comparative interim results can provide adequate power under a range of plausible effect sizes, and therefore, can help ensure that a trial maintains adequate power if the true magnitude of treatment effect is less than what was hypothesized, but still clinically meaningful. Furthermore, the addition of prespecified rules for modifying the sample size can provide efficiency advantages with respect to certain operating characteristics in some settings."

One thing that is often neglected is to compare the final results with the assumptions. When a clinical trial is concluded, it is always good to check how different the final results are from the assumptions. If the final results are positive (indicating the success of the trials), people tend to ignore the assumptions made during the trial planning stage. Only if the final results are negative (indicating the failure of the trials), do people tend to go back to the assumptions and claim that the trial failed due to inaccurate assumptions leading to the lack of statistical power. 

Biogen's Tofersen for SOD1-ALS

Biogen designed a Valor study as the pivotal study to investigate the effect of tofersen for the treatment of patients with Amyotrophic Lateral Sclerosis (ALS) associated with mutations in the superoxide dismutase 1 (SOD1) gene (SOD1-ALS) - a subset of general ALS population. The primary efficacy endpoint is  the ALSFRS-R score and the sample size for the study was based on assumptions about the ALSFRS-R score. 

"We calculated that a sample size of 60 participants (2:1 randomization ratio) in the faster-progression primary analysis subgroup would provide 84% power to detect a between-group difference on the basis of the joint rank test (described below), assuming a change in the ALSFRS-R score from baseline to week 28 of −4.8 in the tofersen group and −24.7 in the placebo group, with a standard deviation of 20.39 and survival of 90% in the tofersen group and 82% in the placebo group, at a two-sided alpha level of 0.05."

The final results indicated that assumptions were so inaccurate. In the placebo group, the change from baseline to week 28 is -8.14 (versus assumed -24.7).

Usually, it is the sponsor's responsibility to ensure that the assumptions for sample size calculation are as accurate as possible. If inaccurate assumptions are used in sample size calculation that leads to the failure of the trial, the regulatory agency may request the sponsor to do additional trials (with more accurate assumptions). However, in Biogen's Tofersen Vilor trial, FDA came to the defense of Biogen why the trial failed in the primary efficacy endpoint in ALSFRS-R score so that they could potentially approve a drug based on the positive results in biomarker and discredit the fact that the study failed in clinical endpoint. In FDA's briefing book for the advisory committee to discuss the Tofersen in SOD1-ALS, the following was mentioned:

Comparing the assumptions for sample size estimation with the analysis results can be complicated by the fact that different statistical methods are used. Sample size estimation may be based on a two-sample t-test while the actual data will be analyzed using more complicated methods (analysis of covariance, mixed model repeated measures, random coefficient model, non-parametric methods,...). For studies with a time-to-event primary efficacy endpoint, the sample size calculation may be based on the log-rank test, and the statistical analyses may be based on the Cox regression where analyses are adjusted for multiple explanatory variables. 

However, it is always good to compare the assumptions for the sample size estimation with the observed data (during the study or at the conclusion of the study). 

Wednesday, May 17, 2023

Another successful trial with randomized withdrawal design

Biotech company PTC Therapeutics announced today that their phase III study of Sepiapterin in PKU patients achieved the primary efficacy endpoint.

PTC Therapeutics Announces APHENITY Trial Achieved Primary Endpoint 

with Sepiapterin in PKU Patients

PKU (Phenylketonuria) is a rare, inherited metabolic disease, which affects the brain. It is caused by a defect in the gene that helps create the enzyme needed to break down phenylalanine. If left untreated or poorly managed, phenylalanine – an essential amino acid found in all proteins and most foods – can build up to harmful levels in the body. This causes severe and irreversible disabilities, such as permanent intellectual disability, seizures, delayed development, memory loss, and behavioral and emotional problems. There are an estimated 58,000 people with phenylketonuria globally.

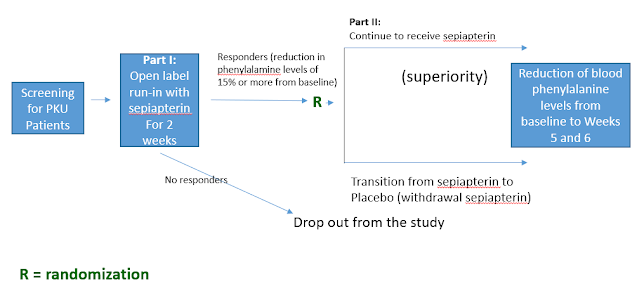
The pivotal license trial is called APHENITY trial and the randomized withdrawal design was used for the trial even though the randomized withdrawal design was not explicitly mentioned. According to PTC's new release, the APHENITY study is described as the following:
APHENITY was a global double-blind, placebo-controlled, registration-directed study which enrolled 156 children and adults with PKU. Participants were randomized to receive sepiapterin or placebo for six weeks with the primary endpoint being reduction in blood phenylalanine levels. The trial consisted of two parts. Part 1 was a run-in phase, during which all screened subjects received sepiapterin for two weeks. Only those subjects who demonstrated a reduction in phenylalanine levels of 15% or more from baseline in Part 1 were randomized to receive either sepiapterin or placebo in Part 2 of the clinical trial. The primary analysis population consists of those who had greater than 30% reduction in phenylalanine levels from baseline during Part 1 of the trial. The primary outcome measure is the reduction of blood phenylalanine levels from baseline compared to Weeks 5 and 6 in patients from Part 2 of the clinical trial. All patients are eligible to enroll in an open label long term clinical trial designed to further evaluate the long-term safety and durable effect of sepiapterin.

The study design (randomized withdrawal design) can be depicted in the following diagram: 


Through the APHENITY trial, it is demonstrated that the randomized withdrawal design can be successfully used in the pivotal study of the rare, inherited metabolic disease.

Refer to the previous posts on randomized withdrawal design:

Monday, May 01, 2023

Violin plot versus Box-Whisker Plot

A box and whisker plot (Also called: box plot, box-whisker diagram) is defined as a graphical method of displaying variation in a set of data. In most cases, a histogram provides a sufficient display, but a box and whisker plot can provide additional detail while allowing multiple sets of data to be displayed in the same graph. The box-whisker plot displays the following in the data set. 

  1. Minimum value: The smallest value in the data set
  2. Second quartile: The value below which the lower 25% of the data are contained
  3. Median value: The middle number in a range of numbers
  4. Third quartile: The value above which the upper 25% of the data are contained
  5. Maximum value: The largest value in the data set

The box-whisker plot can also indicate the mean value (the dot). The difference between the mean value and the median value can indicate how skewed the data is. 


The box and whisker plot can also include the outliers where outliers are defined as values below Q1 - 1.5 * IQR or values above Q3 + 1.5 IQR (Q1 is 25th percentile and Q3 is 75th percentile, IQR - Interquartile is the distance between 25th percentile and 75th percentile). 


Boxplot can include the only box with lower, upper quartile and median, but not include the min and max values. In a paper by White et al "Combination Therapy with Oral Treprostinil for Pulmonary Arterial Hypertension A Double-Blind Placebo-controlled Clinical Trial", the boxplots without min and max were used to present the NT-proBNP data (a measure with skewed distribution). 

Recently, I see several papers using violin plots to display the data distribution. According to Wikipedia:

A violin plot is a statistical graphic for comparing probability distribution. It is similar to a box plot, with the addition of a rotated kernel density plot on each side.

Violin plots are similar to box plots, except that they also show the probability density of the data at different values, usually smoothed by a kernel density estimator. Typically a violin plot will include all the data that is in a box plot: a marker for the median of the data; a box or marker indicating the interquartile range; and possibly all sample points, if the number of samples is not too high.

A violin plot is more informative than a plain box plot. While a box plot only shows summary statistics such as mean/median and interquartile ranges, the violin plot shows the full distribution of the data. The difference is particularly useful when the data distribution is multimodal (more than one peak). In this case a violin plot shows the presence of different peaks, their position and relative amplitude.

Like box plots, violin plots are used to represent comparison of a variable distribution (or sample distribution) across different "categories" (for example, temperature distribution compared between day and night, or distribution of car prices compared across different car makers).

A violin plot can have multiple layers. For instance, the outer shape represents all possible results. The next layer inside might represent the values that occur 95% of the time. The next layer (if it exists) inside might represent the values that occur 50% of the time.

Although more informative than box plots, they are less popular. Because of their unpopularity, they may be harder to understand for readers not familiar with them. In this case, a more accessible alternative is to plot a series of stacked histograms or kernel density distributions.


In a paper by Colli et al "Burden of Nonsynonymous Mutations amongTCGA Cancers and Candidate Immune CheckpointInhibitor Responses", the violin plot was used to display the distribution for r the number of NsM (log10) across different tumor types. 


SAS has a procedure Proc BOXPLOT to generate the box-whisker plots and SAS codes are also provided for generating the Violin plots. Other data analysis software including R have packages to generate the box-whisker plot and violin plot.