Showing posts with label Statistical analysis. Show all posts

Monday, May 01, 2023

Violin plot versus Box-Whisker Plot

A box and whisker plot (Also called: box plot, box-whisker diagram) is defined as a graphical method of displaying variation in a set of data. In most cases, a histogram provides a sufficient display, but a box and whisker plot can provide additional detail while allowing multiple sets of data to be displayed in the same graph. The box-whisker plot displays the following in the data set. 

  1. Minimum value: The smallest value in the data set
  2. Second quartile: The value below which the lower 25% of the data are contained
  3. Median value: The middle number in a range of numbers
  4. Third quartile: The value above which the upper 25% of the data are contained
  5. Maximum value: The largest value in the data set

The box-whisker plot can also indicate the mean value (the dot). The difference between the mean value and the median value can indicate how skewed the data is. 


The box and whisker plot can also include the outliers where outliers are defined as values below Q1 - 1.5 * IQR or values above Q3 + 1.5 IQR (Q1 is 25th percentile and Q3 is 75th percentile, IQR - Interquartile is the distance between 25th percentile and 75th percentile). 


Boxplot can include the only box with lower, upper quartile and median, but not include the min and max values. In a paper by White et al "Combination Therapy with Oral Treprostinil for Pulmonary Arterial Hypertension A Double-Blind Placebo-controlled Clinical Trial", the boxplots without min and max were used to present the NT-proBNP data (a measure with skewed distribution). 

Recently, I see several papers using violin plots to display the data distribution. According to Wikipedia:

violin plot is a statistical graphic for comparing probability distribution. It is similar to a box plot, with the addition of a rotated kernel density plot on each side.

Violin plots are similar to box plots, except that they also show the probability density of the data at different values, usually smoothed by a kernel density estimator. Typically a violin plot will include all the data that is in a box plot: a marker for the median of the data; a box or marker indicating the interquartile range; and possibly all sample points, if the number of samples is not too high.

A violin plot is more informative than a plain box plot. While a box plot only shows summary statistics such as mean/median and interquartile ranges, the violin plot shows the full distribution of the data. The difference is particularly useful when the data distribution is multimodal (more than one peak). In this case a violin plot shows the presence of different peaks, their position and relative amplitude.

Like box plots, violin plots are used to represent comparison of a variable distribution (or sample distribution) across different "categories" (for example, temperature distribution compared between day and night, or distribution of car prices compared across different car makers).

A violin plot can have multiple layers. For instance, the outer shape represents all possible results. The next layer inside might represent the values that occur 95% of the time. The next layer (if it exists) inside might represent the values that occur 50% of the time.

Although more informative than box plots, they are less popular. Because of their unpopularity, they may be harder to understand for readers not familiar with them. In this case, a more accessible alternative is to plot a series of stacked histograms or kernel density distributions.


In a paper by Colli et al "Burden of Nonsynonymous Mutations amongTCGA Cancers and Candidate Immune CheckpointInhibitor Responses", the violin plot was used to display the distribution for r the number of NsM (log10) across different tumor types. 


SAS has a procedure Proc BOXPLOT to generate the box-whisker plots and SAS codes are also provided for generating the Violin plots. Other data analysis software including R have packages to generate the box-whisker plot and violin plot.  

Sunday, January 15, 2023

Rank Preserving Structural Failure Time Model (RPSFTM) to account for treatment crossover

In a previous post "Treatment crossover in parallel-group, randomized, controlled clinical trials", treatment crossover was discussed. Treatment crossover (or treatment switching) occurs when patients switch from their randomized arm to the other treatment during the study. In handling the treatment crossover, the naïve approaches (such as ITT analysis, exclusion of the treatment crossover subjects, and censoring at the time of the crossover) can cause a biased estimate of the treatment difference. More sophisticated approaches are needed to handle the treatment crossover. One of these approaches is called 'Rank Preserving Structure Failure Time Model (RPSFTM)". 

RPSFTM method was proposed by Robins and Tsiatis (1991) in their paper "Correcting for Non-Compliance in Randomized Trials Using Rank Preserving Structure Failure Time Models". The RPSFTM is a method used to adjust for treatment switching in trials with survival outcomes. The method is randomization based and uses only the randomized treatment group, observed event times and treatment history in order to estimate a causal treatment effect. The treatment effect is estimated by balancing counter-factual event times (i.e. the time that would be observed if no treatment were received) between treatment groups. 

We are seeing examples of RPSFTM application in oncology trials (especially open-label randomized trials) and in rare disease clinical trials. 

Hussain et al (2022) published a paper on NEJM "Survival with Olaparib in Metastatic Castration-Resistant Prostate Cancer". The results were from an open-label, phase 3 trial where patients were randomly assigned in 2:1 ratio to receive olaparib or physician's choice of enzalutamide or abiraterone plus prednisone as the control therapy. Patients in the control therapy group were allowed to be crossed over to olaparib after imaging-based disease progression criteria were met. Overall survival was analyzed using the naïve approach (intention-to-treat approach). Sensitivity analysis using the RPSFTM method was then performed to adjust for control patient crossover to olaparib.  Kaplan-Meier plots for the observed data and for crossover-adjusted analysis were depicted below: 


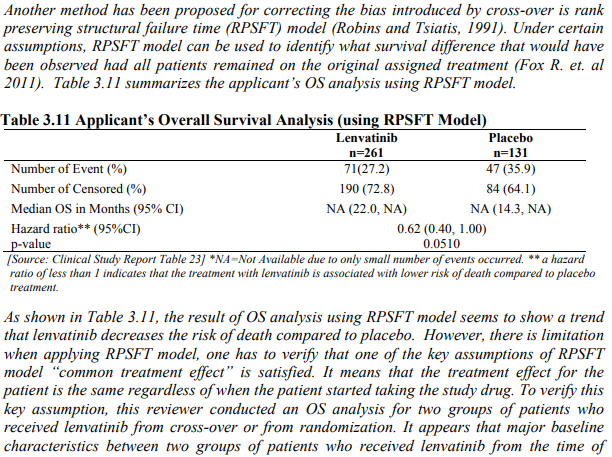
EISAI's Lenvatinib was approved for the treatment of patients with progressive, radioiodinerefractory differentiated thyroid cancer. The NDA approval was based on a pivotal study (Study 303). Study 303 is an international, double-blind, randomized 2:1, placebo-controlled, parallel-group, 2-arm trial. Patients would receive lenvatinib or placebo daily and could be treated until disease progression confirmd by IIR (RECIST v1.1) or unacceptable toxicity. The primary endpoint was progression-free survival with secondary endpoints of ORR and overall survival. Patients randomized to the placebo arm who had confirmed progression could choose to cross over and receive open-label lenvatinib. Overall survival was analyzed with the pooled data from the randomized portion of the study and the optional open-label extension phase. The effect of lenvatinib on overall survival was potentially confounded by the crossover of 83% of patients on the placebo arm to receive lenvatinib in the optional open-label (OOL) extension Phase.

The rank preserving structural failure time (RPSFT) model was then used in OS analysis to correct the bias introduced by cross-over and estimate the true treatment effect on OS. Here is the reference of RPSFT in the FDA's statistical review:


Amylyx's RELYVRIO was approved by FDA for the treatment of ALS. The approval was based on a pivotal study (CENTAUR) and its open-label extension study (CENTAUR-OLE). The pivotal CENTAUR study was a randomized, placebo-controlled, double-blind, 24-weeks study in patients with ALS. Patients who completed 24-week randomized treatment were rolled over to an open-label extension study where all patients received the active drug. Patients in the active drug group in the randomized trial would continue with the active drug in the open-label extension study; patients in the placebo group in the randomized trial would switch or cross over to the active drug. To provide substantial evidence of the effectiveness of the active drug, the sponsor performed the analyses for long-term overall survival with the combined data from the randomized study and the open-label extension study. RPSFTM method was employed to handle the switch or crossover of the placebo patients in the randomized study to active drug in the OLE. Here is the description of the RPSFTM analysis from the briefing book for FDA Adcom


The drug Uptravi was approved for the treatment of pulmonary arterial hypertension. The efficacy and safety were based on a pivotal study followed by an open-label extension study. The pivotal study was designed as an event-driven study where patients who had clinical worsening events would be rolled over to the open-label extension study. The placebo patients in the randomized study would switch or cross over the active drug in the open-label extension study. While the randomized study showed the treatment benefit in reducing the risk of clinical worsening events, there was an imbalance in the number of deaths (more death events in active drug group than the placebo group).  The analyses for long-term overall survival with the combined data from the randomized study and the open-label extension study became necessary to mitigate the concern about the imbalance in the number of deaths observed in the randomized trial. RPSFTM method was employed to handle the switch or crossover of the placebo patients in the randomized study to the active drug in the OLE. EMA's assessment report described the RPSFTM analyses. 


An add-on package (RPSFTM) publically available for fitting rank preserving structural failure time models is available for R (Bond and Allison, 2017), and can be installed from the CRAN web portal. A SAS program was written by Bradford J. Danner and Indrani Sarkarto to perform RPSFTM analysis
 

 Additional References: 

Sunday, January 08, 2023

Treatment crossover in parallel-group, randomized, controlled clinical trials

Randomized, controlled clinical trial (RCT) is the golden standard in drug development. RCTs are usually designed as parallel-group to compare the experimental treatment with a control group (usually the placebo). Eligible patients are randomized to one of the treatment arms (the experimental treatment or placebo). The patients who are randomized to the experimental treatment arm will receive the experimental treatment for the duration of the study and patients who are randomized to the placebo arm will receive the placebo for the duration of the study. 

There are situations where the treatment crossover is allowed by the protocol and the treatment crossover is usually one-sided (i.e., patients on the placebo arm crossed over to the experimental treatment arm, not patients on the experimental treatment arm crossed over to the placebo arm). Treatment crossover can be seen in oncology clinical trials (especially the open-label, randomized trials) or in rare disease clinical trials where the RCT is followed by an open-label extension study. 

In EMA's scientific guidance "Question and answer on adjustment for cross-over in estimating effects in oncology trials", the treatment crossover was described as the following:

In oncology trials, one-sided cross-over of control patients to the experimental treatment may occur, e.g. after progression. No objections from a methodological perspective exist against systematic crossover, where systematic means that there is an objective criterion which determines whether a control patient will cross over to the experimental treatment, or not. One example is when all control patients switch to experimental treatment at the same calendar time (e.g. after an interim analysis declaring superiority); however, this is provided that unconfounded overall survival (OS) data are not considered necessary to evaluate efficacy or safety. Another example of systematic cross-over is when by design a control patient must switch to experimental treatment when that patient experiences progression and the outcome is another measure than progression, e.g. OS, if it is justified to use this design. Nonsystematic cross-over can occur, for instance, when the study protocol allows cross-over after progression at the discretion of the investigator. This document addresses the situation where crossover of control patients is not systematic and there is interest in estimating the effect in the (hypothetical) situation that no cross-over would have occurred in the trial, under the assumption that the experimental treatment cannot introduce harm or deterioration of the condition under investigation in the control patients who cross over. In particular, it should be fully justified that this hypothetical effect is a relevant one for regulatory decision making. It should be noted that due to the uncertainties involved in the methods described below, such estimations should, at present, be used primarily as supportive or sensitivity analyses. 

The guidance defines the treatment crossover as systematic crossover and nonsystematic crossover:

  • Systematic crossover is for clinical trials where there is an objective criterion which determines whether a control patient will cross over to the experimental treatment, or not
  • Nonsystematic cross-over can occur, for instance, when the study protocol allows cross-over after progression at the discretion of the investigator

Systematic crossover can be seen in the following situations: 

  • all control patients switch to experimental treatment at the same calendar time (e.g. after an interim analysis declaring superiority; at the time of study closure)
  • individual patients switch to experimental treatment at a different time when patient experiences an event (progression, clinical worsening event, or complete the scheduled treatment duration)
  • or a mixture of both situations above
In rare disease areas, the clinical development program usually includes an RCT followed by an open-label study. Because of the rarity of the patients and lack of alternative treatment options, clinical trial participants who complete the randomized portion of the study will be rolled over to an open-label extension (OLE) study where all patients receive experimental treatment. To consider the RCT portion and OLE portion of the study as a whole, the patients in the control arm are crossed over to the experimental treatment arm and the patients in the experimental treatment arm continue the experimental treatment (no crossover). By design, patients who receive the control in the RCT portion of the study cross over to experimental treatment in the OLE portion of the study, which is a perfect example of a systematic crossover. 

Amylyx conducted a phase 2 RCT with a fixed treatment duration (24 weeks) "Trial of Sodium Phenylbutyrate–Taurursodiol for Amyotrophic Lateral Sclerosis". Patients who completed 24 weeks of study treatment (Sodium Phenylbutyrate–Taurursodiol or placebo) were then rolled over a separate open-label extension study where all patients received Sodium Phenylbutyrate–Taurursodiol. Overall survival was analyzed using the combined data from both the RCT and the OLE studies. This can also be viewed as a one-sided crossover where all patients in the placebo arm crossed over to the experimental treatment arm in the OLE. In this case, individual patients switch to experimental treatment at different calendar times, but all after the scheduled RCT duration of 24 weeks. 

The RCT could also be designed as an event-driven study, patients who experienced an event would then be rolled over to the OLE study. Patients who do not experience an event would also be rolled over the OLE study at the RCT study closure when the total number of events was reached. This situation can also be viewed as a one-sided crossover where all patients in the placebo arm crossed over to the experimental treatment arm when they are rolled over to the OLE study. In this case, individual patients who experience an event switch to experimental treatment at different calendar times, but individual patients who do not experience an event switch to experimental treatment at the same calendar time after the total number of events are reached and the study is closed.  See the following examples: 

Different approaches can be employed to analyze the data from clinical trials with one-sided treatment crossover. 

EMA's scientific guidance "Question and answer on adjustment for cross-over in estimating effects in oncology trials" mentioned the following methods:

Different statistical methods have been proposed to adjust overall survival for cross-over, including analysis censoring at time of cross-over, Inverse Probability of Censoring Weighting (IPCW), Rank Preserving Structural Failure Time models (RPSFT), and ‘two-stage’ methods.

In principle, these methods can (be adapted to) address different questions by formulating distinct estimands. For example, IPCW estimates the effect of the experimental treatment versus control as if cross-over by control group patients to the experimental treatment was absent but still includes subsequent therapies. Using RPSFT the analyst could choose the estimate to aim at the effect of experimental therapy only (effect of being ‘on experimental treatment’), but in practice the effect of experimental therapy and subsequent therapies (effect of ‘ever being treated’) is often estimated.

In a presentation by Norbert Hollaender "Methods to estimate survival time after treatment switching in oncology– overview and practical considerations", the following simple('naive') methods and complex methods were discussed:

Simple (‘naive’) methods 

    • Intent to treat analysis: as randomized and ignoring that some patients switched
    • Exclude treatment switchers: small sample size for control group; destroying the randomization; may produce biased results
    • Censor switches at time of ‘cross-over’: informative censoring -> results may be biased
    • Time-varying treatment variable: No longer a comparison between randomized Treatment vs. Control arm, more difficult interpretation

Complex methods 

    • Inverse-probability-of-censoring weighting (IPCW) :
      • Switchers are censored at ‘time point of cross-over’, but patients are weighted according to their probability to switch treatment.
      • IPCW method artifically increases weights for patients with low probability of treatment switch and decreases weights for patients with high probability of treatment switch
    • Rank Preserving Structural Failure Time (RPSFT) Model
      • The RPSFTM models the counter-factual or treatment-free event time
      • Estimate the survival time gained/lost by receiving active treatment

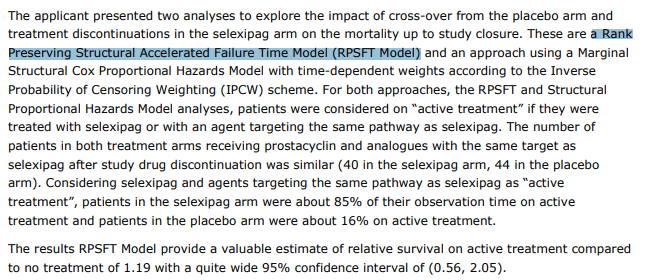
In practice, for clinical trial data containing patients with one-sided treatment crossover, the overall survival data may be analyzed using both RPSFT and IPCW methods. The results from different methods can then be compared. For example, in EMA's assessment report for Uptravi (selexipag), both RPSFT and IPCW methods were used to evaluate overall survival with the data from the RCT and the OLE studies. 

The applicant presented two analyses to explore the impact of cross-over from the placebo arm and treatment discontinuations in the selexipag arm on the mortality up to study closure. These are a Rank Preserving Structural Accelerated Failure Time Model (RPSFT Model) and an approach using a Marginal Structural Cox Proportional Hazards Model with time-dependent weights according to the Inverse Probability of Censoring Weighting (IPCW) scheme. For both approaches, the RPSFT and Structural Proportional Hazards Model analyses, patients were considered on “active treatment” if they were treated with selexipag or with an agent targeting the same pathway as selexipag. The number of patients in both treatment arms receiving prostacyclin and analogues with the same target as selexipag after study drug discontinuation was similar (40 in the selexipag arm, 44 in the placebo arm). Considering selexipag and agents targeting the same pathway as selexipag as “active treatment”, patients in the selexipag arm were about 85% of their observation time on active treatment and patients in the placebo arm were about 16% on active treatment.

The results RPSFT Model provide a valuable estimate of relative survival on active treatment compared to no treatment of 1.19 with a quite wide 95% confidence interval of (0.56, 2.05).

Using the Structural Proportional Hazards Model with IPCW weighting the estimate for the hazard ratio for death as if all patients had received active treatment compared to the situation if all patients had never received active treatment was 0.92 with a 95% confidence interval of (0.58, 1.47) for the 1 month time intervals, showing a slight advantage for treatment with selexipag. Both estimations with models with longer time intervals show non-significant lower hazard ratios (0.79 and 0.75).

Tuesday, November 15, 2022

Treatment Emergent AEs (TEAEs), On-Study AEs, On-Treatment AEs, Non-TEAEs

During the clinical trial, the adverse events (AEs) are collected from the signing of the informed consent to the last dose of the study drug plus some follow-time. For statistical analyses of adverse event data, the treatment-emergent AEs (TEAEs) are usually defined. AEs with an onset date at or after the first dose of the study drug will be defined as TEAEs. AEs with an onset date prior to the first dose of the study drug will then be defined as Non-TEAEs. 

For example, the TEAE can be defined as:

"TEAEs are defined as events that start within the day of the first dose of trial treatment until 28 days after the last dose of treatment" in an SAP for an EMD Serono study.

"Treatment-emergent AEs (TEAEs) are defined as AEs that are not present at baseline or represent an exacerbation of a preexisting condition during the treatment period. Therefore, referencing the protocol, TEAEs will be defined programmatically as any AE record with a start date/time on or after the first study treatment administration (greater than or equal to study day 1), inclusive to the end of the study (specifically the EOS visit or ET visit)." in an SAP for a Regeneron's study

The TEAEs can be further defined based on the comparison of the AE onset date with a cut-off date where the cut-off date may be the last dose date or 28 days after the last dose date. 

In FDA's clinical review document for AstraZeneca's asthma drug, the on-study AE and on-treatment AE were defined:

  • On-study AE: events with onset between the first-day dosing and the scheduled follow-up visit. 
  • On-treatment AE: events with onset between the first day of treatment and the scheduled end of treatment (EOT) or investigational product discontinuation (IPD) visit. 
  • Post-treatment AE: events with onset after the on-treatment period defined above

 On-study AEs include all TEAEs - all AEs recorded on or after the first dose date. 

On-treatment AEs are a subset of all TEAEs or on-study AEs. The AEs with an onset date after the cut-off date will be excluded from on-treatment AEs. 

There are some clinical trials with on-treatment AEs defined as the same as traditional TEAEs (i.e., any AEs with an onset date on or after the first dose of the study drug regardless of the cut-off date).

In a recent workshop "Advancing Premarket Safety Analysis" organized by FDA and Duke Margolis Center for Health Policy, the on-study and on-treatment AEs were specifically discussed. Here are the presentation slides for this topic:


The concept of on-treatment AEs has already been implemented in some clinical trials. For example, in a GSK-sponsored trial "A Phase 3a, Repeat Dose, Open-label, Long-term Safety Study of Mepolizumab in Asthmatic Subjects", the primary outcome measure is "Number of Participants With Any On-treatment Adverse Event (AE) or On-treatment Serious AE (SAE)" where On-treatment AEs and on-treatment SAEs are the events occurring on/after the first dose of open-label mepolizumab date and before/on last dose+28 days.

In a BMS trial "A randomized, open-label, phase 3 study of  BMS-936558 vs. Everolimus in Subjects with advanced or metastatic clear-cell renal cell carcinoma who have received prior anti-angiogenic therapy", the on-treatment AEs were defined as the following with a cut-off date of 100 days of the last dose of study treatment.
"On-treatment AEs will be defined as AEs with an onset date-time on or after the DateTime of the first dose of study treatment (or with an onset date on or after the day of first dose of study treatment if time is not collected or is missing). For subjects who are off study treatment, AEs will be counted as on-treatment if event occurred within 100 days of the last dose of study treatment. No “subtracting rule” will be applied when an AE occurs both pre-treatment and post-treatment with the same preferred term and grade."
Defining on-treatment AEs will require specifying a cut-off date and the cut-off date may be different depending on the potential impact of the study drug after the drug discontinuation and the half-life of the investigational products. 

Defining on-treatment AEs may be necessary for studies with the treatment policy estimand where the efficacy data and AE/SAEs are continued to be collected after the study participants have discontinued the study treatment. 

Previous discussions: 

Monday, August 22, 2022

Story of BrainStorm's Stem Cell Treatment for ALS - Criticality of the Statistical Analyses

This past week, the biotech company BrainStorm announced the decision to submit a BLA to the FDA for NurOwn® (a stem cell treatment) for the treatment of ALS (Amyotrophic Lateral Sclerosis). The news stirred quite some discussions. The decision to submit the BLA is driven by the reanalysis or the corrected analysis of the previously announced negative results from their pivotal study. In their news announcement, they stated the following: 
New clinical analyses strengthen the conclusions from NurOwn's® Phase 3 clinical trial

A correction was made to the Muscle and Nerve publication from December 2021 describing the results of NurOwn's® Phase 3 clinical trial in ALS following new clinical analyses which strengthen the Company's original conclusions from the trial. The correction results in a statistically significant treatment difference (p=0.050) of more than 2 points for an important secondary endpoint, average change from baseline in ALSFRS-R, in the pre-specified efficacy subgroup of participants with a baseline score of at least 35. Analyses reported in the original publication utilized an efficacy model that unintentionally deviated from the trial's pre-specified statistical analysis plan by erroneously incorporating interaction terms between the subgroup and treatment. The newly published results, which includes supporting information to the publication, employ the efficacy model as pre-specified in the trial's statistical analysis plan, correcting the analyses. The correction also relates to the other subgroup analyses published for this endpoint, demonstrating that all subgroups with ALSFRS-R baseline scores of at least 26 to 35 showed a statistically significant benefit following treatment with NurOwn® (p≤0.050) on this secondary endpoint.

The reanalysis (or as they called it 'correction') was only on the pre-specified subgroup analyses for the secondary endpoint of ALSFRS-R total score (as highlighted in yellow below from the original publication). 


An erratum was issued to present the 'corrected' results for this endpoint: 


The original publication reported results for ALSFRS-R total score subgroup endpoint using a model that unintentionally deviated from the pre-specified statistical analysis plan by erroneously incorporating interaction terms between the subgroup and treatment. The error was made by the CRO who performed the statistical analyses. Applying the correct statistical model for that outcome resulted in the average difference between NurOwn- and placebo-treated patients going from 2.01 points to 2.09 points, but importantly this difference became statistically significant with a P-value of 0.05 (from a p-value of 0.20 in the original analysis). 

While the trial did not reach statistical significance on the primary or secondary endpoints, the company believes these corrected analyses support the conclusion that NurOwn has a positive treatment effect for patients with ALS. 

A year and a half ago, FDA put out a statement (unusual) to advise the BrainStorm not to file the BLA based on the announced results after unblinding of their phase 3 study. FDA specifically stated the following: 
With the recent completion of a randomized phase 3 controlled clinical trial comparing NurOwn to placebo, it has become clear that data do not support the proposed clinical benefit of this therapy. Data indicated that none of the primary or secondary endpoints were met in the group of patients who were randomized. For the main (primary) endpoint, 27.7% of people given the placebo were scored as responding compared to 32.6% of people given NurOwn. The 4.9% absolute difference in responders was not at all statistically significant, and the small difference between the two groups was most likely due to chance. In addition, there was a modest excess in deaths in those treated with NurOwn, the significance of which is unclear at this time. If BrainStorm plans further studies of NurOwn to determine if the product can provide clinical benefit to individuals with ALS, FDA will continue to provide advice to the company on their development program.
Now, A year after FDA slammed on the breaks, BrainStorm is hitting the gas with updated data, approval plans, we will see how the FDA will react to BrainStorm's plan and if FDA will accept the BLA filing by BrainStorm. 

No matter what the fate is for BrainStorm's BLA, one thing is clear: the statistical analyses are critical to the clinical trials and to the overall drug development. It is so important to avoid errors/mistakes in the statistical analyses. This important point has been discussed in previous posts such as "Statistician's nightmare - mistakes in statistical analyses of clinical trials" and "Futility Analysis and Conditional Power When Two Phase 3 Studies are Simultaneously Conducted" where the inappropriate method for futility analysis was implemented. 

It is surprising that the p-value and the statistical significance are still playing a critical role in regulatory decision-making after all of these discussions about retiring statistical significance and p-value