Tuesday, February 01, 2022

Randomization, Re-Randomization, and Micro-Randomization

 I recently saw a Twitter post mentioning "Micro-Randomized Study Design Example - Maryland Alcohol-Dependent Moms Abstinence (MAMA) Study" and found the term 'micro-randomization' interesting and prompted me to compare the concept of randomization, re-randomization, and micro-randomization. Based on the number of times that a subject can be randomized in a study, we can differentiate the studies as randomized, re-randomized, and micro-randomized trials. 

Randomization is the process of assigning subjects (patients, clinical trial participants) by chance to groups that receive different treatments. In the simplest trial design (parallel-group design), the investigational group receives the new treatment and the control group receives standard therapy. At several points during and at the end of the clinical trial, researchers compare the groups to see which treatment is more effective or has fewer side effects. Randomization helps prevent bias. Bias occurs when a trial's results are affected by human choices or other factors not related to the treatment being tested.

ICH Topic E 9Statistical Principles for Clinical Trials has an entire section discussing randomization as the key design technique to avoid biases:

"2.3.2 Randomisation

Randomisation introduces a deliberate element of chance into the assignment of treatments to subjects in a clinical trial. During subsequent analysis of the trial data, it provides a sound statistical basis for the quantitative evaluation of the evidence relating to treatment effects. It also tends to produce treatment groups in which the distributions of prognostic factors, known and unknown, are similar. In combination with blinding, randomisation helps to avoid possible bias in the selection and allocation of subjects arising from the predictability of treatment assignments.

The randomisation schedule of a clinical trial documents the random allocation of treatments to subjects. In the simplest situation it is a sequential list of treatments (or treatment sequences in a crossover trial) or corresponding codes by subject number. The logistics of some trials, such as those with a screening phase, may make matters more complicated, but the unique pre-planned assignment of treatment, or treatment sequence, to subject should be clear. Different trial designs will require different procedures for generating randomisation schedules. The randomisation schedule should be reproducible (if the need arises).  

......"

In typical clinical trials, the study participants will be randomized only one time whether to different treatments or different treatment sequences. For clinical trials with parallel-group design, subjects are randomized to receive one of two or more treatments. For clinical trials with cross-over design, subjects are randomized to follow one of two or more treatment sequences. Once the treatment sequence is determined, subjects will follow the sequence to receive multiple treatments (for example, treatment A then treatment B or treatment B than treatment A,...)

The vast majority of randomized clinical trials are falling into this category and this includes:

  • randomized double-blind trials: randomization + blinding 
  • randomized open-label trials: randomization without blinding
  • randomized cross-over trials: randomization to the sequence of treatments
  • adaptive randomized trials: adjust the randomization ratio
  • "N of 1" clinical trials: can be considered as a high order crossover, once the sequence is decided, the treatments at various stages are decided
Re-randomization is the process describing a situation where each patient can be randomized more than one time in the same study.  There are two types of re-randomization:

re-randomization in SMART trial design framework - SMART stands for Sequential Multiple Assignment Randomized Trial. In a trial with SMART designs, the same subject may be randomized more than once depending on the response to the initial assigned treatment after the initial randomization. According to the paper by Kidwell et al "Sequential, Multiple Assignment, Randomized Trial Designs in Immuno-oncology Research", A SMART is a multistage, randomized trial in which each stage corresponds to an important treatment decision point. Participants are enrolled in a SMART and followed throughout the trial, but each participant may be randomized more than once. Subsequent randomizations allow for unbiased comparisons of post-initial randomization treatments and comparisons of treatment pathways. The goal of a SMART is to develop and find evidence of effective treatment pathways that mimic clinical practice.

In a review paper by Wallace at el "SMART Thinking: a Review of Recent Developments in Sequential Multiple Assignment Randomized Trials", the following general diagram was given for SMART design:

We saw that SMART design with re-randomization was used in clinical trials in different therapeutic areas:

In a paper by Almirall et al "Introduction to SMART designs for the development of adaptive interventions: with application to weight loss research", the following diagram was used to illustrate a SMART design for weight loss research. After the initial randomized treatment period, the responders and non-responders are identified. The non-responders were re-randomized to different treatments. 


Ruppert et al described a study with SMART design in CLL "
Application of a sequential multiple assignment randomized trial (SMART) design in older patients with chronic lymphocytic leukemia" where patients with complete response after stage 1 were re-randomized to receive two different treatments at stage 2. 


We conducted an ICE study - a registration study with IGIV-C in CIDP (a rare neurology disease) "Intravenous immune globulin (10% caprylate chromatography purified) for the treatment of chronic inflammatory demyelinating polyradiculoneuropathy(ICE study): a randomised placebo-controlled trial". We did not explicitly state the SMART design but did employ the re-randomization in the study. The subjects who were responders (to the blinded treatment) were re-randomized to receive either IGIV-C or Placebo in additional six months follow-up period. The re-randomized portion of the study was to compare the relapse rate between two treatment groups - a key secondary efficacy endpoint. 

With the re-randomized portion of the study, we built in two randomizations in the same study and demonstrated the treatment effect of IGIV-C in the primary efficacy endpoint of improving the responder rate and also the treatment effect of IGIV-C in preventing the relapse in the additional follow-up period - essentially two studies in one. This was used as a rationale for a single pivotal trial (two studies in one) to provide substantial efficacy for effectiveness. 

Re-randomization is also discussed for use in different settings where the subjects who complete the initial randomized period are put back to the randomization pool. Subjects were re-randomized to the study as if they are new to the study. In other words, the same subject was re-used and re-randomized into the study. Kahan et al described this type of re-randomized trial as the following: 


This type of re-randomized design is very rarely used and may be used in clinical trials with ultra-rare diseases that patient recruitment is extremely challenging. 

A Micro-randomized trial (MRTs) can be considered as an extension of the SMART design. The same subject can be randomized and re-randomized many times to different interventions. The time scale is much more frequent and short (for example several times in a day). The term 'micro-' can be confusing, but it is used to differentiate this type of randomization from the classical setting where randomization can not be too frequently. The term 'micro-' is used to describe a setting where the randomization/re-randomization needs to be conducted more frequently on a much short time scale - almost continuous time points. A Micro-randomized trial is good for the interventions that are delivered through mobile devices (such as push notification) and is good for interventions that are intended for changing subjects' behaviors. 

Here is a website describing what the micro-randomized trial is:

In micro-randomized trials (MRTs), individuals are randomized hundreds or thousands of times over the course of the study. The goal of these trials is to optimize mobile health interventions by assessing the relative effect of different intervention options and assessing whether the intervention effects vary with time or the individual's current context. With MRTs we can gather data to construct optimized just-in-time adaptive interventions (JITAIs).

Intervention options can include either or both engagement strategies and therapeutic treatments. Consider the Heartsteps MRT (described below) that is designed to promote physical activity among sedentary people. Heartsteps includes phone notifications with tailored activity suggestions to encourage physical activity; these are therapeutic in focus. On the other hand the SARA MRT (also described below) is designed to promote engagement by young adults in substance abuse research. SARA includes rewards for participants who complete assessments; these are engagement strategies. The design of both of these projects can be seen in the “Projects Using MRTs” section, below.

In an MRT, each participant can be randomized many times. For example in the Heartsteps project, the researchers identified five times throughout the day when people are mostly likely to be available to take a brief walk. At each of the five time points, the application randomizes between delivering a phone notification containing a tailored activity suggesion or to not deliver anything; as a result over the course of the 42 days, each participant is randomized 210 times. This sequence of both within-participant and between-participant randomizations comprises the MRT.

The MRT data can then be used to assess the effectiveness of the tailored activity suggestions and to build rules for when to deliver the suggestions in order to help individuals be more active. To do this the application records a variety of outcomes. In this case, the app collects the minute-by-minute step count from the participant’s activity-tracking wristband throughout the day, the participant’s overall level of physical activity, and the participant’s context at each of the 5 times per day (using GPS to determine the person’s location and the local weather). The resulting data is used by researchers to assess the effectiveness of the activity suggestions and to build rules for when and where to deliver the suggestions. In other MRTs, the randomization could apply to what type of intervention to provide, rather than whether or not to provide an intervention. The ultimate goal of Heartsteps is the development of a JITAI that will successfully encourage higher levels of physical activity. The study design of the MRT used in Heartsteps is shown below.

MRTs are an emergent innovation in behavioral science.

We are in the digital era and digital tools will become more used in interventions (especially the adaptive intervention) for lifestyle and behavior changes. However, we don't think that the 'micro-randomized trials' will be suitable for drug trials for registration purposes. 

Monday, January 17, 2022

Paired T-test and McNemar's test for paired data based on the summary data

Sometimes, it is necessary for us to calculate the p-values based on the summary (aggregate) data without the individual subject level data. In a previous post, group t-test or Chi-square test based on the summary data was discussed. Group t-test and chi-square test can be used in the setting of parallel-group comparisons. 

In single-arm clinical trials, there is no concurrent control group, and the statistical test is usually based on the pre-post comparison. For continuous measures, the pre-post comparison can be tested using paired t-test based on the change from baseline values (i.e., post-baseline measures - baseline measures):  For discrete outcomes, the pre-post comparison may be tested using McNemar's test.

Paired t-test:

A paired t-test is used when we are interested in the difference between two variables for the same subject. Suppose we have the descriptive statistics for change from baseline values: 83 subjects had the outcome measures at both baseline and week 12 (therefore, 83 pairs), the mean and standard deviation for these 83 pairs are: 10.7 (70.7); 68 subjects had the outcome measures at both baseline and week 24 (therefore 68 pairs), the mean and standard deviation for these 68 pairs are 20.2 (80.9). 

With the mean difference, the standard deviation for differences, and the sample size (# of pairs), we have all the elements to calculate the t statistics and therefore the p-value using the formula below. 

This can be implemented in SAS as the following - t-statistics and p-values can be calculated for each of weeks 12 and 24 based on the aggregate data. 
 

McNemar's Test:

McNemar's test is a statistical test used on paired nominal data. It is applied to 2 × 2 contingency tables with a dichotomous trait, with matched pairs of subjects, to determine whether the row and column marginal frequencies are equal (that is, whether there is "marginal homogeneity"). In clinical trials, the aggregate data may not be obvious as a 2 × 2 contingency table but can be converted into a 2 × 2 contingency table. 

Suppose we have the following summary data for post-baseline week 12: the number and percentage of subjects with improvement, stable (no change), and deterioration categories. 


All subjects

(n=300)

Week 12

Improved

  54 (18%)

No Change

228 (76%)

Deteriorated

  18 (  6%)

At Week 12, there are more subjects in the 'Improved' category than in the 'Deteriorated' category even though the majority of subjects are in the 'No Change' category. Are they more subjects with improvement than deterioration? 

Assuming that change from category 1 to 0 is 'Improved' and change from category 0 to 1 is 'Deteriorated', the table above can be converted into a 2 × 2 table: 


Baseline

0

1

Week 12

0

228

54

1

18

0

or


Baseline

0

1

Week 12

0

0

54

1

18

228

For McNemar’s test, only the numbers in the diagonal discordant cells (in our case, the # of improved and the # of deteriorated) are relevant.

The concordant cells (in our case, the # of no change) will only contribute to the sample size (therefore the degree of freedom), not have an impact on the p-value. How the # of subjects with the ‘No Change’ is split doesn’t matter with our calculation of chi-square statistics and therefore the p-value.

For the data highlighted in yellow, McNemar’s test can be performed using the SAS codes like this (weight statement indicates count variable is the frequency of the observation and agree option requests McNemar's test). How the 228 subjects in the concordance ‘No Change’ category are split has no impact on the p-value calculation. 


Sunday, January 09, 2022

Overrunning issue at the interim analysis for group sequential design

It is pretty common these days that clinical trials (especially the late phase, adequate, and well-controlled studies) employ interim analyses to determine if the efficacy results are too good so that the study should be stopped early for overwhelming efficacy, or if the efficacy results are not good so that the study should be stopped early for futility, or both. A study with formal interim analyses to look at the comparative efficacy is called 'group sequential design' even though the 'group sequential design' may not be formally used in the study protocol. Group sequential design is the most common type of adaptive design as described in the FDA guidance "adaptive designs for clinical trials". 

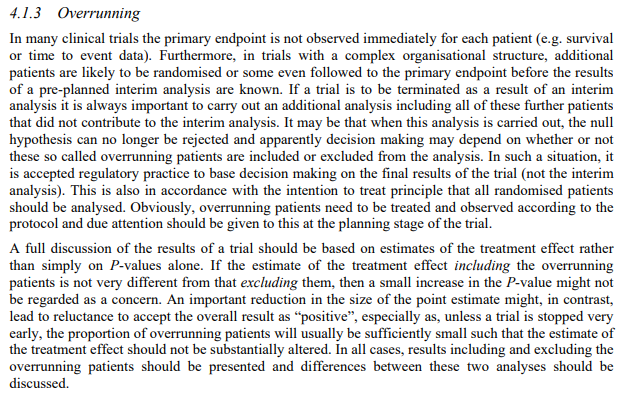
As mentioned in an early post "overrunning issues in adaptive design clinical trials", one of the issues with interim analyses in group sequential design is the overrunning issue. Overrunning consists of extra data, collected by investigators while awaiting results of the interim analysis (IA). Overrunning is the 
phenomenon that data will continue to accumulate after it is decided to stop a trial (Whitehead, 1992). In many cases there will be patients who have already been admitted to the trial but whose responses are not yet known. Also some extra patients will enter the trial because of the delay between the moment the data for the final interim analysis were retrieved, and the moment participating clinical centers receive instruction to stop recruitment.

EMA guidances "reflection paper on methodological issues in confirmatory clinical trials planned with an adaptive design" had a full paragraph discussing the overrunning issue: 


When planning for an interim analysis, the decision needs to be made about the timing of the interim analysis and what data is to be included in the interim analysis. For an event-driven study where the number of events is the endpoint, the timing of the interim analysis can be based on the percentage of the events, for example, the interim analysis can be performed when 50% of the total number of events are accrued. In other words, once 50% of the total number of events is achieved. For a longitudinal design, the endpoint is measured at various intervals. At any time during the study, there will be patients at different stages of the study (reaching the end of the study, reaching a specific duration of the study, or just being randomized into the study). It is more difficult to determine a good timing for interim analysis. Suppose that an interim analysis is planned when 50% of subjects reach the end of the study, by that time, there will be plenty of subjects in the various stage of the study already, just having not reached the end of study yet. If the study enrollment is pretty fast and the study endpoint is pretty long (for example 52 weeks), by the time 50% of subjects reach the study endpoint, the majority of subjects (if not all) have already been randomized into the study. 

If the interim analysis results trigger the recommendation of discontinuing the study early (either for efficacy or futility), the debate is whether the interim analysis needs to be re-run by including the overrunning subjects before adopting the recommendation to discontinue the study early. 

This exact issue about the handling of the overrunning subjects was discussed in Biogen's aducanumab clinical trials in Alzheimer's disease. As I discussed in a previous post "Futility Analysis and Conditional Power When Two Phase 3 Studies are Simultaneously Conducted", Biogen made the wrong decision and discontinued its pivotal studies (EMERGE and ENGAGE) where one of the studies was later found to have statistically significant treatment effects. The wrong decision was driven by two issues: 

  • they calculated the conditional powers based on the pooled data from both studies (instead of calculating the conditional powers separately based on the data from individual studies) - this was discussed in the previous post
  • they stopped the study early without re-running the interim analysis by including the overrunning subjects. 

The overrunning issue was mentioned in a recent article in the Wall Street Journal (Jan 4, 2022) "How Biogen Fumbled Its Alzheimer's Drug ---Once-promising Aduhelm is pricey and without proven efficacy"

"By evaluating data midstream in approval-seeking trials, companies can try to predict whether a drug will succeed if the trial continues. Stopping trials early for "futility," in industry parlance, can save millions of dollars and prevent patients from investing hope on an ineffective drug.

In a March 2019 meeting, Biogen executives on a small "senior decision team," as the company called it, concluded that the trials were doomed. Biogen pulled the plug and asked researchers around the world to shut down trials. It told more than 3,000 Alzheimer's patients who had volunteered that they would no longer receive treatment.

Biogen stock fell by nearly 30% the day of the announcement.

Biogen executives made errors in shutting down the trials. The trial plan called for analyzing data after half of patients completed the study treatment in late December 2018. By the time Biogen completed the analysis in March 2019, three more months of additional data were available -- but the decision team didn't scrutinize the additional data before the company halted the trials, Biogen has said.

A Biogen consultant in the summer of 2018 recommended to senior Biogen statisticians that they consider all available trial data, according to a person involved in the process. The consultant cautioned them that a plan to leave out consideration of additional trial data after the cutoff date -- and to leave out certain data from patients in the trial before the cutoff -- would open up Biogen to criticism and scrutiny, the person said. The statisticians didn't heed the consultant's advice, and it isn't clear whether the decision team or management considered the recommendation, the person said.

Biogen declined to comment on past discussions with its consultants but said it followed its pre-established statistical-analysis plan.

The decision not to consider the three months of additional data was a misstep, said some clinical-trial experts and statisticians. "Additional data after a study stops is called 'overrunning.' We plan for it," said Scott Emerson, a professor emeritus of biostatistics at the University of Washington who served on an FDA advisory committee that recommended against approving Aduhelm in November 2020. "In this case, the overrunning data was large."

The Biogen spokeswoman said: "Our decision to stop the trials, though clearly incorrect in hindsight, was based on putting patients at the forefront -- as it always should be. Cost was not considered in determining futility."

Only in the weeks after the trials stopped did Biogen scientists complete a preliminary analysis of the overrunning data and recognize their mistake, the Biogen spokeswoman said. The data seemed to show that one of the trials would have produced positive results, despite the likelihood of a negative outcome in the second trial. Initially, Biogen had analyzed combined data from both trials."

Even though the aducanumab was finally approved by FDA through the accelerated approval pathway, the approval was very controversial - the first drug and the only drug so far that was approved based on studies that had been stopped early for futility. There are strong pushback from academic about the use of aducanumab because of its unapproved efficacy and perhaps also because of the drama of resurrecting a drug that was declared failed. 

We all wonder: had these two pivotal studies not been stopped for futility by the sponsor, what would be the situation now for aducanumab? 

Saturday, January 01, 2022

Futility Analysis and Conditional Power When Two Phase 3 Studies are Simultaneously Conducted

In late-phase clinical trials, an independent Data Monitoring Committee (DMC) is usually set up. If the clinical program includes multiple late-phase studies, the same DMC will be responsible for the entire program. With DMC, the interim analyses can be performed for different purposes:
  • The interim analysis for safety
    • with pre-specified stopping rule (for example stop the trial if the significant imbalance in # of Serious Adverse Events or in # of deaths)
    • without pre-specified stopping rule (rely on DMC members to review the overall safety)
  • The interim analysis for efficacy: To see if the new treatment is overwhelmingly better than the control group  - then stop the trial for efficacy
  • The interim analysis for futility (futility analysis): To see if the new treatment is unlikely to be better than the control group or the study will be unlikely to achieve its objective given the data at the interim – then stop the trial for futility.
There seem to be more studies with built-in futility analysis without interim analysis for overwhelming efficacy, mainly because of the concerns about the alpha-spending for efficacy. The futility analysis will have an impact on the beta-spending and the statistical power, but not on the alpha-spending. For the decision-making, regulatory agencies are usually more concerned about the alpha level (incorrectly approves a drug that does not work) or the alpha level inflation. The sponsors are more concerned about the statistical power (incorrectly concludes a drug not working while the drug is actually working).

Futility analysis usually requires calculating the Conditional Power (CP) that is defined as the probability that the final study result will be statistically significant, given the data observed thus far at the time of the interim data cut and a specific assumption about the pattern of the data to be observed in the remainder of the study, such as assuming the original design effect (alternative hypothesis) or the effect estimated from the interim data.  

If there is one single pivotal trial, the stopping rule and the CP are relatively straightforward. However, it is uncommon that the sponsor may need to conduct two pivotal (phase 3) studies (two adequate and well-controlled (A&WC) trials in FDA's term) to demonstrate substantial evidence of effectiveness as outlined in FDA guidance for industry "Demonstrating Substantial Evidence of Effectiveness for Human Drug and Biological Products Guidance for Industry".

For a clinical program with two independent A&WC trials (usually with identical design), the futility analysis and CP calculation are a little bit more complicated. Two independent A&WC trials may have an identical design but be executed differently (i.e., may not be started at the same time; may be conducted in different geographic regions/countries; and may have different enrollment speeds,...). 

When futility analysis is performed for two A&WC trials, should the conditional powers be calculated for individual studies separately or should the conditional powers be calculated for both studies together (i.e. pooled data from both studies)? 

When there are two identical A&WC trials, the interim analysis for safety should be based on the pooled data sets from both studies because it will give a more definitive answer to the safety issues, the interim analysis for efficacy should be based on the individual study data because the decision about the overwhelming efficacy should be based on the individual study, not the integrated data from two studies; the interim analysis for futility is a little bit more complicated and the decision to use the data from an individual study or to use the data from the pooled data seems to be dependent on how close the observed results from two A&WC trials are at the time of the interim analysis. 

For futility analysis using stochastic curtailment procedure, While CPs can be calculated for each individual study assuming that the treatment effect in the remaining subjects in the same study will follow the treatment effect estimated from the data of this same study at the time of the interim data cut, 

There is an alternative way to calculate the CP, i.e., to calculate the CP for each individual study, but use the observed treatment effect from the pooled data at the interim from both studies to project the trend and pattern for the remaining subjects. 

According to the paper by Lan and Wittes (1988) "The B-Value: A Tool for Monitoring Data", the CP calculation involves the decomposition of overall critical value (B-value or B1 for example) into the sum of two statistically independent interval B-values: 
  • Bt, the value of B that accumulated up through time t when interim analysis is conducted; and 
  • (B1 - Bt), the incremental value of B that accumulates from time t through the end of the study. The legitimacy of the decomposition follows from the independence of distributions of the outcomes for successive study subjects
At the time t when the interim analysis is conducted, Bt is known and is estimated from the observed data up to the time t. (B1 - Bt) is a random variable that needs to be estimated. The conditional power is derived by fixing Bt and calculating the probability that Bt + (B1 - Bt) will exceed Z1-a/2.

To calculate the CPs when there are two identical A&WC studies, t, as a measure of the information fraction, will be different for different studies. At the time t, maybe 60% of subjects have been enrolled in study #1 while 50% of subjects are enrolled in study #2. In CP calculations, the Bt part will be obtained from the individual study. The (B1-Bt) part is estimated assuming the remaining data following the observed effect up to the interim time t, should the observed effect up to the interim time t be based on the data from the individual study or from the pooled data?

It turns out both approaches can be used: 
  • estimate the treatment differences for each individual study and calculate the CP assuming that the reminding data follows the trend and pattern based on the observed data from individual study
  • estimate the treatment difference from both studies and calculate the CP assuming that the remaining data follow the trend and pattern based on the observed data from the pooled data of two studies.           
For both of these approaches, the CPs will be calculated for each individual study (therefore one CP for each study). The difference between these two approaches is in the calculation of the (B1-Bt) part - based on the individual study itself or based on the pooled data from both studies. 

We can take a look at the famous and controversial case in Biogen's aducanumab program in Alzheimer's disease. Aducanumab program in Alzheimer's diseases consisted of two pivotal, phase 3 studies (EMERGE (study 301) and ENGAGE (study 302)), and both studies were designed the same and conducted simultaneously globally. Each study had two active arms (low dose and high dose of aducanumab) versus placebo - therefore two hypothesis tests (low dose vs. placebo and high dose vs. placebo). There was a total of four hypothesis tests (two for each study).  The protocol and SAP specified the interim analysis for futility. 

An interim analysis was performed after approximately 50% of the subjects had the opportunity to complete the Week 78 visit for both EMERGE and ENGAGE studies. An interim analysis for the futility of the primary endpoint was performed to allow early termination of the studies if it was evident that the efficacy of aducanumab was unlikely to be achieved. The futility criteria were based on conditional power, which was the chance that the primary efficacy endpoint analysis would be statistically significant in favor of aducanumab at the planned final analysis, given the data at the interim analysis. The CP was calculated assuming that the future unobserved effect was equal to the maximum likelihood estimate of what is observed in the interim data. 

For each study, two CPs were calculated. The pre-specified CP calculation was to use the pooled interim data from both EMERGE and ENGAGE studies for the (B1-Bt) part and assume that the treatment effect for the remaining of the study would follow the observed treatment effect at the interim analysis. At the interim analysis, the CPs were calculated to be 13% for low dose vs placebo and 0% for high dose vs. placebo in EMERGE study, and 11% for low dose vs placebo and 12% for high dose vs. placebo in ENGAGE study. Given all four CPs were lower than the threshold of 20% (a criterion for futility), the DMC recommended stopping both studies for futility.  Biogen followed the DMC recommendation and stopped both EMERGE and ENGAGE studies for futility
.

Only after two terminated studies were wrapped up, the reanalyses of the final data indicated that there were statistically significant treatment differences in one of the studies (the ENGAGE study). With the help of the FDA, Biogen was able to submit the BLA and obtain approval for aducanumab for Alzheimer's disease. Leading to the FDA approval, there was an advisory committee meeting to review the aducanumab data. In FDA's presentation, the conditional powers were retrospectively re-calculated - this time, the conditional powers were calculated for each individual study and assumed future unobserved effect would be similar to the interim data for each individual study (not the pooled interim data). FDA claimed that CPs using this approach were more appropriate and would have one of the four CPs above the threshold of 20% (CP=59% for high-dose vs placebo in ENGAGE study) - the studies would not be recommended for stopping for futility. 


Retrospectively, CPs calculated for each study independently (not using the pooled interim data to project the trend and pattern for the remaining data) seemed to be better in Biogen aducanumab program consisting of two A&WC trials. 

However, in a paper by Deng et al "Superiority of combining two independent trials in interim futility analysis", CP calculation using the observed treatment effects from the pooled interim data from two studies was considered a better approach. It concluded, "it is demonstrated that by leveraging data from the other study, the probability of making correct interim decision is increased if the treatment effects are similar between the two studies, and such benefit remains even if there is small to moderate between-study difference."

It is probably true that CP calculation using the pooled data at the interim to project the trend and pattern for the remainder data is a better approach if two studies are conducted in the same way and the results at the time of the interim analysis are similar. However, the CP calculation and the statistical analysis plan for interim analysis are usually pre-specified before seeing the unblinded data. At the time of the interim analysis, it is usually unknown whether or not the results (treatment effects) observed from two identical studies will be similar. Even though two A&WC studies are designed the same, the operation and execution of the trial can still be different: two studies may be conducted in different countries, enrollment speed may be different,... As evidenced by Biogen's EMERGE and ENGAGE trials, two identical designed studies may have different results - therefore calculating the CP entirely independently for each study may be more appropriate when two identical A&WC trials are conducted.   

Monday, December 27, 2021

Futility Analysis and Conditional Power

Adaptive design has been used to drug development programs more efficient. According to FDA's guidance Adaptive Designs for Clinical Trials of Drugs and BiologicsGuidance for Industry, an adaptive design is defined as a clinical trial design that allows for prospectively planned modifications to one or more aspects of the design based on accumulating data from subjects in the trial. The modifications to the design based on the accumulating data from an ongoing study are through 'interim analysis'. An interim analysis is any examination of data obtained from subjects in a trial while that trial is ongoing and is not restricted to cases in which there are formal between-group comparisons. The observed data used in the interim analysis can include one or more types, such as baseline data, safety outcome data, pharmacokinetic, pharmacodynamic, biomarker data, or efficacy outcome data.

when an adaptive design is proposed, which aspect(s) of the trial to be adapted will need to be pre-specified and agreed upon by the regulatory agencies such as FDA. In the list of adaptations, the most common type of adaptive design is 'group sequential design'. 

    • Group sequential design
    • Adaptations to the sample size
    • Adaptations to the patient population (e.e., adaptive enrichment)
    • Adaptations to treatment arm selection
    • Adaptations to patient allocation 
    • Adaptations to endpoint selection
    • Adaptations to multiple design features

Group sequential design is probably the most commonly used adaptive design (even before the adaptive design concept came out). Group sequential design was once categorized as 'well-understood' adaptive design. Ironically, many studies with group sequential design may not be called 'adaptive design' and the term 'group sequential design' may not be used in the study protocol at all. 

According to FDA's Adaptive Designs for Clinical Trials of Drugs and Biologics Guidance for Industry

"Group sequential designs may include rules for stopping the trial when there is sufficient evidence of efficacy to support regulatory decision-making or when there is evidence that the trial is unlikely to demonstrate efficacy, which is often called stopping for futility."

"There are a number of additional considerations for ensuring the appropriate design, conduct, and analysis of a group sequential trial. First, for group sequential methods to be valid, it is important to adhere to the prospective analytic plan and terminate the trial for efficacy only if the stopping criteria are met. Second, guidelines for stopping the trial early for futility should be implemented appropriately. Trial designs often employ nonbinding futility rules, in that the futility stopping criteria are guidelines that may or may not be followed, depending on the totality of the available interim results. The addition of such nonbinding futility guidelines to a fixed sample trial, or to a trial with appropriate group sequential stopping rules for efficacy, does not increase the Type I error probability and is often appropriate. Alternatively, a group sequential design may include binding futility rules, in that the trial should always stop if the futility criteria are met. Binding futility rules can provide some advantages in efficacy analyses (e.g., a relaxed threshold for a determination of efficacy), but the Type I error probability is controlled only if the stopping rules are followed. Therefore, if a trial continues despite meeting prespecified binding futility rules, the Agency will likely consider that trial to have failed to provide evidence of efficacy, regardless of the outcome at the final analysis. Note also that some DMCs might prefer the flexibility of nonbinding futility guidelines."

With group sequential design, interim analyses will be performed during the study to evaluate early evidence of efficacy or early evidence of futility. To stop the study for efficacy, the most common approach is so-called 'repeat significance testing'. to stop the study for futility, the most common approach is through calculating the conditional power.

Group sequential design:
  • The interim analysis for efficacy: To see if the new treatment is overwhelmingly better than control - then stop the trial for efficacy
    • Repeat significance testing
      • Pocock
      • O'Brien-Fleming
      • Alpha-spending by Lan and DeMets 
  • The interim analysis for futility (futility analysis): To see if the new treatment is unlikely to be superior to the control – then stop the trial for futility - this is called ‘futility analysis’.
    • Repeat significance testing
    • Stochastic curtailment approach with three families of stochastic curtailment tests
      • Conditional power tests (frequentist approach)
      • Predictive power tests (mixed Bayesian-frequentist approach).
      • Predictive probability tests (Bayesian approach)

The most common futility analysis requires the calculation of the conditional power (CP) that is the probability that the study will demonstrate statistical significance at the end of the study (i.e. final analysis to claim superiority), conditioning on the data observed in the study thus far, and an assumption about the trend of the data to be observed in the remainder of the study. 

According to the paper by Lachin "A review of methods for futility stopping based on conditional power":
“Conditional power (CP) is the probability that the final study result will be statistically significant, given the data observed thus far and a specific assumption about the pattern of the data to be observed in the remainder of the study, such as assuming the original design effect, or the effect estimated from the current data, or under the null hypothesis.”

In conditional power calculation, assumptions about the trend of the data in the remainder of the study can be as the following and the assumption of the remainder data following the observed data is probably more reasonable. The assumption of the remainder data following the alternative hypothesis can overestimate the overall treatment effect (especially if the alternative hypothesis was based on the aggressive, over-optimistic assumptions) resulting in inflated conditional power. On the other hand, the assumption of the remainder data following the null hypothesis can underestimate the overall treatment effect resulting in deflated conditional power.  

  • Observed data - the effect estimated from the current data so far
  • The alternative hypothesis - assuming the original design effect
  • The null hypothesis - assuming no effect in the remainder of the study 

To summarize, the futility analysis is through interim analysis to determine if the trial data indicates the inability of a clinical trial to achieve its objectives. Futility analysis usually requires the calculation of the conditional power (CP) that is defined as the probability that the final study result will be statistically significant, given the data observed thus far at the time of the interim data cut and a specific assumption about the pattern of the data to be observed in the remainder of the study, such as assuming the original design effect (alternative hypothesis) or the effect estimated from the current data. It is pretty common that the threshold for futility is defined as CP less than 20% - suggesting that the probability of the final result to be statistically significant is less than 20% given the data observed at the time of interim analysis. If the CP is less than 20% at the time of the interim analysis, the Data Monitoring Committee may recommend the sponsor stop the trial (stop the trial for futility).  

in a book chapter by Tin, Ming T "Conditional Power in Clinical Trial Monitoring", the pros and cons of conditional power were discussed. 

To put things in perspective, the conditional power approach attempts to assess whether evidence for efficacy or the lack of it based on the interim data is consistent with that at the planned end of the trial by projecting forward or using conditional likelihood given the eventuality. Thus it substantially alleviates the major inconsistency in all other group sequential tests where different sequential procedures applied to the same data yield different answers. ...

The advantage of the conditional power approach for trial monitoring is its flexibility. It can be used for unplanned analysis and even analysis whose timing depends on previous data. For example, it allows inferences from overrunning or underrunning (namely, more data come in after the sequential boundary is crossed, or the trial is stopped before the stopping boundary is reached. Conditional power can be used to aid the decision for early termination of a clinical trial to complement the use of other methods or when other methods are not applicable. 

The caveat is that the conditional power can be calculated with different assumptions about the remaining data. Depending on the assumptions about the remaining data following the observed data, the alternative hypothesis (original design effect), or others, the conditional power can sometimes be quite different resulting in different conclusions about the futility assessment. 

Some examples: 

in the SAP for "Randomized, Open-Label Study of Abiraterone Acetate (JNJ-212082) plus Prednisone with or without Exemestane in Postmenopausal Women with ER+ Metastatic Breast Cancer Progressing after Letrozole or Anastrozole Therapy", conditional power was described to be calculated with both the assumption of the remaining data following the original hazard ratio (alternative hypothesis) and the assumption of the remaining data following the observed hazard ratio at the interim.
3.1.2 Conditional Power

Conditional power is the probability that the study will demonstrate statistical significance at the end of the study (i.e. final analysis to claim superiority on PFS), conditioning on the data observed in the study thus far, and an assumption about the trend of the data to be observed in the remainder of the study. Two assumptions about the trend of the data were presented below: The futility boundary corresponds to a conditional power of approximately 39% if the original hazard ratio assumption is true, while only 4% conditional power will be achieved if the observed hazard ratio at interim is true for the remainder of the study. The efficacy boundary corresponds to a conditional power of approximately 90% if the original hazard ratio assumption is true, and 92% conditional power will be achieved if the observed hazard ratio at interim is true for the remainder of the study. The conditional power of stopping boundaries was computed using method of Lan (2009).
In Gilead's trial "A Multicenter, Adaptive, Randomized Blinded Controlled Trial of the Safety and Efficacy of Investigational Therapeutics for the Treatment of COVID-19 in Hospitalized Adults", the repeat significant test procedure (the alpha spending function) was used to evaluate the potential stop for overwhelming efficacy and the stochastic curtailment approach (conditional power) was used to evaluate the potential stop for futility. 


In a trial by Incyte "GRAVITAS-301: A Randomized, Double-Blind, Placebo-Controlled Phase 3 Study of Itacitinib or Placebo in Combination With Corticosteroids for the Treatment of First-Line Acute Graft-Versus-Host Disease", interim data monitoring for the potential stop for efficacy or futility is assessed and conditional power of 20% is used as the threshold for declaring the futility: 


Further reading: 

Saturday, December 11, 2021

Interventional Study (Clinical Trial), Non-interventional Study (Observational Study), and Registry Study

 FDA recently issued two separate guidance documents for industry: 

While these two guidance documents are focused on real-world data (RWD) and real-world evidence (RWE), they also provided the definitions for distinctions for interventional study, non-interventional study, and registry study. 

Some of the terms are confusing and non-distinguishable, for example, we use clinical study and clinical trial interchangeably and we use registry and non-interventional study interchangeably, Based on FDA guidance documents, these different terms are for describing different types of studies. 

The term clinical study means research that evaluates human health outcomes associated with taking a drug of interest. Clinical studies include interventional (clinical trial) designs and non-interventional (observational) designs. 

Interventional Study (also referred to as a Clinical Trial)
the term interventional study (also referred to as a clinical trial) is a study in which participants, either healthy volunteers or volunteers with the disease being studied, are assigned to one or more interventions, according to a study protocol, to evaluate the effects of those interventions on subsequent health-related biomedical or behavioral outcomes. One example of an interventional study is a traditional randomized controlled trial, in which some participants are randomly assigned to receive a drug of interest (test article), whereas others receive an active comparator drug or placebo. Clinical trials with pragmatic elements (e.g., broad eligibility criteria, recruitment of participants in usual care settings) and single-arm trials are other types of interventional study designs.

Non-interventional study (also referred to as an observational study)

a non-interventional study (also referred to as an observational study) is a type of study in which patients received the marketed drug of interest during routine medical practice and are not assigned to an intervention according to a protocol. Examples of  non-interventional study designs include (1) observational cohort studies, in which patients are identified as belonging to a study group according to the drug or drugs received or not received during routine medical practice, and subsequent biomedical or health outcomes are identified and (2) case-control studies, in which patients are identified as belonging to a study group based on having or not having a health-related biomedical or behavioral outcome, and antecedent treatments received are identified.

Registry study

a registry is defined as an organized system that collects clinical and other data in a standardized format for a population defined by a particular disease, condition, or exposure. Establishing registries involves enrolling a predefined population and collecting prespecified health-related data for each patient in that population (patient-level data). Data about this population can be entered directly into the registry (e.g., clinician-reported outcomes) and can also include additional data linked from other sources that characterize registry participants. Such external data sources can include data from medical claims, from pharmacy and/or laboratory databases, and from EHRs, blood banks, and/or medical device outputs. Trained staff should follow standard operating procedures to aggregate data for a registry and carry out data curation.

Registries range in complexity regarding the extent and detail of the data captured and how the data are curated. For example, registries used for quality assurance purposes related to the delivery of care for a particular health care institution or health care system tend to collect limited data related to the provision of care. Registries designed to address specific research questions tend to systematically collect longitudinal data in a defined population, on factors characterizing patients’ clinical status, treatments received, and subsequent clinical events. The data collected in a given registry and the procedures for data collection are relevant when considering how registry data can be used. 

Registries have the potential to support medical product development, and registry data can ultimately be used, when appropriate, to inform the design and support the conduct of either interventional studies (clinical trials) or non-interventional (observational) studies. Examples of such uses include, but are not limited to: 

  • Characterizing the natural history of a disease
  • Providing information that can help determine sample size, selection criteria, and study endpoints when planning an interventional study 
  • Selecting suitable study participants—based on factors such as demographic characteristics, disease duration or severity, and past history or response to prior  therapy—to include in an interventional study (e.g., randomized trial) that will assign a drug to assess that drug’s safety or effectiveness 
  • Identifying biomarkers or clinical characteristics that are associated with important  clinical outcomes of relevance to the planning of interventional and non-interventional studies
  • Supporting, in appropriate clinical circumstances, inferences about safety and  effectiveness in the context of: 
    • A non-interventional study evaluating a drug received during routine medical practice  and captured by the registry 
    • - An externally controlled trial including registry data as an external control arm

An existing registry can be used to collect data for purposes other than those originally intended, and reusing a registry’s infrastructure to support multiple interventional and non-interventional studies can generate efficiencies. Before designing and initiating an interventional or non-interventional study using registry data for regulatory decisions, sponsors should consult with the appropriate FDA review division regarding the appropriateness of using a specific registry as a real-world data source. 

Registries can generally be categorized as

(1) disease registries that use the state of a particular disease or condition as the inclusion criterion,

(2) health services registries where the patient is exposed to a specific health care service, or

(3) product registries where the patient is exposed to a specific health care product. 

The guidance documents also provided definitions for other types of studies: 

Natural history study

a natural history study is a non-interventional (observational) study intended to track the course of the disease for purposes such as identifying demographic, genetic, environmental, and other (e.g., treatment) variables that correlate with disease development and outcomes. Natural history studies are likely to include patients receiving the current standard of care and/or emergent care, which may alter some manifestations of the disease. Disease registries are common platforms to acquire the data for natural history studies.

Externally controlled trial

An externally controlled trial, as one type of clinical trial, compares outcomes in a group of participants receiving the test treatment with outcomes in a group external to the trial, rather than to an internal control group from the same trial population assigned to a different treatment. The external control arm can be a group, treated or untreated, from an earlier time (historical control) or a group, treated or untreated, during the same time period (concurrent control) but in another setting.

Further Reading: 


Wednesday, December 01, 2021

Clinical Trial Design: Double-Blind Fixed Duration Trial with Long-term Double-Blind Various Treatment Duration

The randomized, double-blind, parallel-group design is the most common type of design for clinical trials (especially the confirmatory clinical trials). This type of design can be further classified into clinical trials with a fixed treatment duration or with various treatment durations. For clinical trials with a fixed duration, all patients are treated with study drugs for a fixed duration (for example, 16 weeks, 24 weeks, 52 weeks,...) and the primary efficacy endpoint will be estimated at the end of the fixed duration (for example, change from baseline in xxx measure at week 16, week 24, or week 52,...). For clinical trials with various durations such as event-driven study design, patients are treated with study drugs for various durations - the early enrolled patients may receive the study drugs for a much longer time than those later enrolled patients, and patients will stay in the study and receive the study drugs if no protocol-defined event occurs until the required number of events for the study has occurred and the entire study is closed. The event can be Clinical Worsening Event, MACE, Exacerbation, Hospitalization, Progression-free survival, Death,...

In the informed consent form, patients who participate in the clinical trial will be informed how long they may be treated with the experimental drug or placebo. The ethical issue arises if patients are randomly assigned to the placebo group and treated with placebo for a prolonged period of time.     

Lately, we saw several clinical trials with a hybrid approach containing a double-blind fixed duration and then followed by a double-blind various duration. The primary efficacy endpoint was measured at the end of the fixed duration (i.e., week 52 for INBUILD and ISABELLA trials and week 24 for STELLAR trial). The double-blind various duration was added to the trial to collect the information for secondary and exploratory endpoints that need a longer exposure time. The double-blind various duration depends on the enrollment speed and the timing of patients entering into the study. Early-enrolled patients will stay in the study much longer than the later-enrolled patients. The slower the enrollment speed is, the longer the double-blind various duration takes. 

INBUILD study: Nintedanib in Progressive Fibrosing Interstitial Lung Diseases 

For each patient, the trial consisted of two parts: Part A, which was conducted during the first 52 weeks, and Part B, which was a variable treatment period beyond week 52 during which patients continued to receive either nintedanib or placebo until all the patients had completed Part A. 


The primary assessment of benefit-risk of nintedanib in patients with PF-ILD will be based on efficacy and safety data over 52 weeks.

The primary analysis of this study will therefore be performed once the last randomized patient reaches the Week 52 Visit (Visit 9 at the end of Part A). At that time, a database lock will occur and all the data will be unblinded. Efficacy and safety analyses will be performed on the data from Part A of the trial to assess the benefit-risk of nintedanib over 52 weeks. In addition, data collected in Part B of the trial (after 52 weeks) and available at the time of data cut-off for the primary analysis will be reported together with data from Part A (i.e. over the whole trial).

Once the benefit-risk assessment of nintedanib over 52 weeks is confirmed to be positive, all patients receiving trial medication in Part B will be offered open-label treatment with nintedanib in a separate study.

Trial 1199.247 i.e. Part B will continue until all patients have been switched to open-label nintedanib or completed the Follow-up Visit. A final database lock will then occur and Part B data collected between the data cut off for the primary analysis and the final database lock will be reported together with data from Part A i.e. over the whole trial.

ISABELLA Studies: GLPG1690, a novel autotaxin inhibitor, in idiopathic pulmonary fibrosis

See the paper: Rationale, design and objectives of two phase III, randomised, placebo controlled studies of GLPG1690, a novel autotaxin inhibitor, in idiopathic pulmonary fibrosis (ISABELA 1 and 2)

In each study, approximately 750 subjects will be randomized 1:1:1 to receive oral GLPG1690 600 mg, GLPG1690 200 mg or matching placebo, once daily, in addition to local SOC. SOC is defined as either pirfenidone or nintedanib, or neither pirfenidone nor nintedanib (for any reason). Treatment will continue for at least 52 weeks (subjects will continue to receive randomized treatment until the last patient reaches 52 weeks in the study). A follow-up visit will be conducted 4 weeks after the end-of-study visit (figure 1 below).


STELLAR Study: Sotatercept in Pulmonary Arterial Hypertension

According to Acceleron's ATS 2021 INTERNATIONAL CONFERENCE ACCELERON INVESTOR AND ANALYST CALL, the STELLAR study was designed as the following:


The double-blind fixed duration is 24 weeks and the primary efficacy endpoint (6MWD) is measured at week 24. The double-blind various duration had a cap at 72 weeks, i.e., the maximum duration for the period is 72 weeks). Patients can be in the long-term double-blind treatment period for 0 (the last enrolled patient) to 72 weeks (early enrolled patients).