Wednesday, December 31, 2008

Significance of the Correlation Coefficient

People can be confused about the interpretation of the correlation coefficient, especially when we observe a small, but statistically significant correlation coefficient. The following paragraphs are from "http://janda.org/c10/Lectures/topic06/L24-significanceR.htm", which explain nicely about the interpretation of the correlation coefficient. In addition, the Wikipedia provides a good introduction about correlation and it also contains a small table to categorize the size (or strength) of the correlation.

Test for the significance of relationships between two CONTINUOUS variables

  • We introduced Pearson correlation as a measure of the STRENGTH of a relationship between two variables
  • But any relationship should be assessed for its SIGNIFICANCE as well as its strength.

A general discussion of significance tests for relationships between two continuous variables.

  • Factors in relationships between two variables

The strength of the relationship: is indicated by the correlation coefficient: r
but is actually measured by the coefficient of determination: r^2

  • The significance of the relationship
    is expressed in probability levels: p (e.g., significant at p =.05)
    This tells how unlikely a given correlation coefficient, r, will occur given no relationship in the population
    NOTE! NOTE! NOTE! The smaller the p-level, the more significant the relationship
    BUT! BUT! BUT! The larger the correlation, the stronger the relationship

  • Consider the classical model for testing significance
    It assumes that you have a sample of cases from a population.
    The question is whether your observed statistic for the sample is likely to be observed given some assumption of the corresponding population parameter.
    If your observed statistic does not exactly match the population parameter, perhaps the difference is due to sampling error.
    The fundamental question: is the difference between what you observe and what you expect given the assumption of the population large enough to be significant -- to reject the assumption?
    The greater the difference -- the more the sample statistic deviates from the population parameter -- the more significant it is.
    That is, the lessl ikely (small probability values) that the population assumption is true.

  • The classical model makes some assumptions about the population parameter:
    Population parameters are expressed as Greek letters, while corresponding sample statistics are expressed in lower-case Roman letters:
    r = correlation between two variables in the sample
    (rho) = correlation between the same two variables in the population
    A common assumption is that there is NO relationship between X and Y in the population: r = 0.0
    Under this common null hypothesis in correlational analysis: r = 0.0
    Testing for the significance of the correlation coefficient, r
    When the test is against the null hypothesis: r_xy = 0.0
    What is the likelihood of drawing a sample with r_xy ­ 0.0?
    The sampling distribution of r is
    approximately normal (but bounded at -1.0 and +1.0) when N is large
    and distributes t when N is small.
    The simplest formula for computing the appropriate t value to test significance of a correlation coefficient employs the t distribution:

t=r*sqrt((n-2)/(1-r^2))

The degrees of freedom for entering the t-distribution is N - 2

  • Example: Suppose you obsserve that r= .50 between literacy rate and political stability in 10 nations
    Is this relationship "strong"?
    Coefficient of determination = r-squared = .25
    Means that 25% of variance in political stability is "explained" by literacy rate
    Is the relationship "significant"?
    That remains to be determined using the formula above
    r = .50 and N=10
    set level of significance (assume .05)
    determine one-or two-tailed test (aim for one-tailed)

t=r*sqrt((n-2)/(1-r^2))=0.5*sqrt((10-2)/(1-.25)) = 1.63
For 8 df and one-tailed test, critical value of t = 1.86
We observe only t = 1.63
It lies below the critical t of 1.86
So the null hypothesis of no relationship in the population (r = 0) cannot be rejected

  • Comments
    Note that a relationship can be strong and yet not significant
    Conversely, a relationship can be weak but significant
    The key factor is the size of the sample.
    For small samples, it is easy to produce a strong correlation by chance and one must pay attention to signficance to keep from jumping to conclusions: i.e.,
    rejecting a true null hypothesis,
    which meansmaking a Type I error.
    For large samples, it is easy to achieve significance, and one must pay attention to the strength of the correlation to determine if the relationship explains very much.


  • Alternative ways of testing significance of r against the null hypothesis
    Look up the values in a table
    Read them off the SPSS output:
    check to see whether SPSS is making a one-tailed test
    or a two-tailed test
  • Testing the significance of r when r is NOT assumed to be 0
    This is a more complex procedure, which is discussed briefly in the Kirk reading
    The test requires first transforming the sample r to a new value, Z'.
    This test is seldom used.
    You will not be responsible for it.
LogMAR in Ophthalmology trials

Vision is typically reported as xxx/yyy where the xxx value is usually 20 for US assessments. As vision gets worse, for the same numerator, the denominator increases.

logMAR is log10(denominator/numerator) or -log10(numerator/denominator)
"normal" vision is 20/20, or logMAR = 0
20/100 is worse than 20/20 and logMAR = 0.69897
So the logMAR increases as vision gets worse and decreases as vision gets better
if you are doing change = visit - baseline, a negative change would be improvement in vision
a positive change would be worsening in vision.

Another interpretation of change in logMar values is to take the antilog of the change in logMAR values - this would be the "number of lines" in which vision changed. FDA often applies a 3 lines of change (ETDRS chart) criteria as this change is a doubling of the visual angle.

A useful reference on calculating average visual acuity and the whole logMAR concept is the article by Jack Holladay "Proper Method for Calculating Average Visual Acuity".

It is also useful to refer to FDA Guidelines for Multifocal Intraocular Lens IDE Studies and PMAs and Guidance for Industry Guidance for Premarket Submissions of Orthokeratology Rigid Gas Permeable Contact Lenses.

AstraZeneca considers pursuing "biosimilars."

From "http://www.delawareonline.com/article/20081230/BUSINESS/812300331"

AstraZeneca is considering joining several of its peers in pursuing "biosimilars" -- generic versions of high-priced biotechnology drugs.

The London-based drug maker has made a push into the $94 billion market for biologics in recent years with the acquisition of Cambridge Antibody Technologies in 2006 and last year's $15.6 billion purchase of Maryland-based MedImmune.
Generic versions of biologics -- drugs made from living cells rather than chemicals -- are not yet approved for sale in the United States.
The complexity of dealing with the larger biological molecules makes it impossible to create an exact copy of a biologic drug, prompting concerns that the biosimilar medicine may end up working differently than the original drug.
But amid the growing popularity and high price tags of many biologics, Congress is expected to consider a regulatory pathway next year to bring biosimilars to market. President-elect Barack Obama has said he supports biosimilars.
Several large drug makers, threatened by patent expirations on top-selling products, are looking at biosimilars as a potential source of revenue. Merck said earlier this month it would start a new unit to copy biologics, and Eli Lilly has also expressed interest in the market.
In an interview published last week by the Financial Times, AstraZeneca CEO David Brennan said the company was studying the launch of biosimilar products, although he said such a move would depend on the legislation being considered by Congress.
AstraZeneca, whose U.S. headquarters is in Fairfax, said in a statement that MedImmune has facilities well-equipped to produce biosimilars, "should we choose to do so and if the legal and regulatory framework allowed.
"However, at the current time, we see the strongest opportunities for the business in flexing its track record of innovation, developing its pipeline of potential biologic candidates to treat or prevent a number of debilitating or life-threatening diseases," the company said.
U.S. and European regulators have a streamlined approval process for generic versions of conventional small-molecule drugs, which are easier to copy than biologics. The European Union has an approval procedure for certain biologics.
Novartis AG's generic-drug unit two years ago became the first company to have a biosimilar product approved: the growth hormone Omnitrope.
The European Commission last August cleared Novartis' anemia drug that is similar to Johnson & Johnson's Eprex and Amgen's Epogen.

Thursday, November 20, 2008

Biosimilar

Biosimilars or Follow-on biologics are terms used to describe officially approved new versions of innovator biopharmaceutical products, following patent expiry.
Unlike the more common "small-molecule" drugs, biologics generally exhibit high molecular complexity, and may be quite sensitive to manufacturing process changes. The follow-on manufacturer does not have access to the originator's molecular clone and original cell bank, nor to the exact fermentation and purification process. Finally, nearly undetectable differences in impurities and/or breakdown products are known to have serious health implications. This has created a concern that copies of biologics might perform differently than the original branded version of the drug. However, similar concerns also apply to any production changes by the maker of the original branded version. So new versions of biologics are not authorized in the US or the European Union through the simplified procedures allowed for small molecule generics. In the EU a specially-adapted approval procedure has been authorized for certain protein drugs, termed "similar biological medicinal products". This procedure is based on a thorough demonstration of "comparability" of the "similar" product to an existing approved product. In the US the FDA has taken the position that new legislation will be required to address these concerns. Additional Congressional hearings have been held, but no legislation had been approved as of December 2007.

Recent FDA Actions Fuel Debate Over Copycat Biotech Drugs11-19-08 3:47 PM EST

NEW YORK -(Dow Jones)- The Food and Drug Administration's scrutiny of production changes by Genzyme Corp. (GENZ) and Amylin Pharmaceuticals Inc. ( AMLN) may signal a tougher stance in eventually evaluating generic versions of biologic drugs - should they ever become legal.

The market for so-called biosimilars could grow to as much as $200 billion a year by the middle of the next decade, as recently estimated by an industry executive, but their regulation will likely be more rigorous than that enjoyed by chemical counterparts. That scrutiny could make their development more difficult and expensive for generic drug makers, possibly hurting sales and forming a barrier to entry that allows only the largest companies to participate.
"This could be a concerted effort on the part of the FDA to draw a line in the sand in advance of a biosimilar pathway," said analyst Chris Raymond with Robert Baird & Co.
The FDA denied that it has changed its policies, saying that it "has had clear and consistent guidance about comparability since 1996." The agency wouldn't comment further.
No pathway for generic biologics exists in the U.S., but legislation to provide a pathway for generic versions is widely expected to be among President- elect Barack Obama's agenda. An official with Obama's transition team declined to comment on the issue.
Currently, generic drug makers can receive approval of copycat small-molecule drugs, like cholesterol-fighting statins, by showing they have the same active ingredient and the same action as the brand-name version, which allows the generics to depend on the original clinical trials and avoid having to pay for new ones.
Biotech drugs, made by culturing specially engineered organisms, are large proteins that are sometimes thousands of times bigger than small-molecule drugs. Their manufacturing makes them sensitive to minor changes in the process, potentially altering their complicated structures and even how they work in the body.
The biotech industry has long argued the complicated nature of the drugs makes it hard for a generic company to copy the drug, and expensive clinical trials should be used to prove similarity.
Earlier this year, the FDA decided that a version of Genzyme's Myozyme, to treat a rare enzyme disorder, produced on a larger scale had slight differences and had to be reviewed as a separate product with clinical data.
"I think what they have done with Myozyme is a pretty big departure," said Raymond, who notes that treating the larger-scale production as a separate brand was "unimaginable" until recently.
The FDA also recently requested more information on the comparability of Amylin Pharmaceuticals' Byetta LAR, an experimental once-weekly version of already approved twice-daily Byetta for diabetes. The issue is between batches of the drug made by partner Alkermes Inc. (ALKS) in its facility, used in previous clinical studies, and batches made on a commercial scale in Amylin's Ohio facility.
Barrier To Entry
The size of the generic biologics markets is unclear. In a 2007 report, Cowen & Co. estimated that U.S. sales of major biologics totaled $25 billion in 2006. Assuming lower prices, and limited penetration of generics, the firm estimates that the total generic revenue from those sales at $2 billion to $7 billion.
That differs greatly with the more recent projection of worldwide biosimilars sales of $200 billion by 2015 from Teva Pharmaceutical Industries Ltd.'s (TEVA) North American chief executive, Bill Marth.
But Raymond points to his own research that shows biosimilars of Amgen Inc.'s (AMGN) anemia treatments aren't being widely adopted in Europe yet.
Understandably, the biotech industry is hoping that the U.S. policies are tougher than in Europe, and it has long pushed for heavy scrutiny, citing the complexity of the products and processes.
The industry, led by the Biotechnology Industry Organization, advocates for clinical data requirements and fighting interchangeability, which allows the generic to be substituted for the branded drug, citing potential safety issues from imperfect drug copies.
While all parties involved are concerned about safety, those policies erect a number of hurdles for the generic companies.
Many observers expect biosimilars to require clinical data to some degree and be distinct products that must be marketed and specifically prescribed by physicians. That may make the drugs more expensive to develop and possibly less lucrative.
Furthermore, the scientific, manufacturing and marketing investment needed to enter such a market will likely allow only the biggest of the generic drug makers to take part, including Teva, Mylan Inc. (MYL) and Novartis AG (NVS).
"This is going to be a big thing. This is going to be very expensive, very intensive," Marth said. "I can't imagine somebody investing less than $1 billion and getting involved in this."
Teva has positioned itself to benefit from any regulatory pathway for biosimilars in the U.S., including its pending $7.46 billion acquisition of Barr Pharmaceuticals Inc. (BRL).
Evan McCulloch, a mutual fund manager with Franklin Templeton, believes that generic companies will have a tougher time selling generic biologics than small- molecule drugs.
He expects clinical trial requirements and companies having to sell biosimilars like a branded product using an expensive sales force, which is a new strategy for most generic companies. All of that could bode well for the biotechnology companies that would face sales pressure from generic competition.
"It is one thing when that drug goes generic and essentially disappears within three months," said McCulloch, referring to the situation seen with small- molecule drugs when generics enter the market, "and another thing entirely when you can bet that that drug is going to hold onto some of its revenues into perpetuity."
-By Thomas Gryta, Dow Jones Newswires; 201-938-2053; thomas.gryta@dowjones.com

Sunday, November 16, 2008

Herbal medicine

I have been thought that the chinese traditional medicine from herbal is typically safe. However, recent discussions with my friends make me extremely nervous about the safety of the herbal medicine. The recent report (see below) is just one of the examples. The reason could be in multifold: 1) the safety is rarely tested in human trials; 2) counterfeit or shoddily made medications ; 3) the original herbal was now grown and harvested in total different climate/environment - the ingredient might be different from the original intended ingredient, some could be toxical. 4) contamination of the herbal raw materials.

China recalls hemorrhoid medicine
The Associated Press
Published: November 12, 2008
BEIJING: China's drug regulator ordered a nationwide recall of a hemorrhoid medicine Wednesday because of concerns it may cause liver problems.
The State Food and Drug Administration said in a statement on its Web site that it had ordered Vital Pharmaceutical Holdings Ltd., based in Sichuan Province, to stop producing Zhixue capsules and begin a nationwide recall. Twenty-one people around the country developed liver problems after taking the medicine in recent months.
"An obvious connection can be found between the hemorrhoid medicine and the liver damage after case analysis, but the cause of the adverse reactions remains unknown," the statement said.

China's pharmaceutical industry is highly lucrative but poorly regulated, resulting in some companies using fake or substandard ingredients. In recent years, a string of fatalities blamed on counterfeit or shoddily made medications has been reported.
Several herbal medicines have been recalled in recent months because of suspicions they have caused deaths, according to the official Xinhua News Agency.

The recalls come as China tries to reassure consumers over a scandal involving the spread of the industrial chemical melamine into the food chain, the latest incident to mar its already troubled product safety record.

Wednesday, November 12, 2008

Analysis Problems with Subgroup Analyses

Sub-grouping damages the balance obtained by randomization

  • If the randomization is stratified for one factor (for example, disease severity), it will ensure the balance of the treatments inside the subgroups defined by that factor but not necessarily the balance of other prognostic factors (unless the subgroups are very large)
  • When minimization is used, the balance for other stratification factors (eg., age category) inside the subgroups is not guaranteed.

Treatment comparisons within subgroups lack power

  • the planned sample size N is large enough for detecting a specified difference in the WHOLE group
  • Sub-grouping -> smaller sample size for each comparison -> lower power
  • The statistical power to detect a treatment by subgroup interaction (ie. different treatment effects between subgroups) is usually very low

It is always possible to find subgroups in which the treatment effect is more extreme than the overall effect (data dredging)

  • It is always possible to find a grouping of the sample such that the treatment effect is more pronounced in one subgroup and less pronounced in the other
  • Indeed, the overall treatment effect is a sort of average of the subgroup treatment effects
  • It is always possible to find a subgroup with a significant difference just by chance!

Subgroup anlaysis induce multiple testing problems

  • Suppose you perform K tests, each of them at the alpha=0.05 significant level, the overall type I error rate (the risk of finding at least one spurious statistically significant result among the K tests) is alpha(overall) = 1-(1-alpha)^k
  • The Bonferoni adjustment must be used to maintain the overall alpha close to 0.05: use alpha/K for each test

Improper subgroups

  • Improper sugroups: subgroups of patients classified by an event measured after randomization and potentially affected by treatment - Response, means or survival comparisons to therapy, by compliance, by severity of side effects, or any factor not stratified for
  • Inherent prognostic features inflence both the endpoint and the event
  • Lead time bias: those who have the event early necessarily fall in the "poor" classification
  • No causality relationship can be demonstrated

Thursday, November 06, 2008

FDA Revises Process for Responding to Drug Applications

The following annoucement really makes sense. Previously, FDA could issue an "approvable" letter that could be very confusing. A product is 'approvable' based on efficacy, but can not be approved due to other safety concern.

http://www.fda.gov/bbs/topics/NEWS/2008/NEW01859.html

The U.S. Food and Drug Administration today announced that it is revising the way it communicates to drug companies when a marketing application cannot be approved as submitted.

Under new regulations that govern the drug approval process, FDA's Center for Drug Evaluation and Research (CDER) will no longer issue "approvable" or "not approvable" letters when a drug application is not approved. Instead, CDER will issue a "complete response" letter at the end of the review period to let a drug company know of the agency's decision on the application.
"These new regulations will help the FDA adopt a more consistent and neutral way of conveying information to a company when we cannot approve a drug application in its present form," said Janet Woodcock, M.D., director of the agency's Center for Drug Evaluation and Research (CDER). "Thorough and timely review of drug applications is a priority of the FDA, and these new processes will make our communications with sponsors of applications more consistent."
Taking the place of "approvable" and "not approvable" letters, a "complete response" letter will be issued to let a company know that the review period for a drug is complete and that the application is not yet ready for approval. The letter will describe specific deficiencies and, when possible, will outline recommended actions the applicant might take to get the application ready for approval.

Currently, when assessing new drug applications, the FDA can respond to a sponsor in one of three types of letters: an "approval" letter, meaning the drug has met agency standards for safety and efficacy and the drug can be marketed for sale in the United States; an "approvable" letter, which generally indicates that the drug can probably be approved at a later date provided that the applicant provides certain additional information or makes specified changes (such as to labeling); or a "not approvable" letter, meaning the application has deficiencies generally requiring the submission of substantial additional data before the application can be approved.
"Complete response" letters are already used to respond to companies that submit biologic license applications. The process for drugs and biologics will be consistent under the new regulations.

The revision should not affect the overall time it takes the FDA to review new or generic drug applications or biologic license applications. These changes, which will become effective on Aug. 11, 2008, are not expected to directly affect consumers.
In July 2004, the FDA issued a proposed rule on these topics. At that time the agency asked for comments on the proposal. Today's final rule addresses comments submitted to the agency.
For more information, see:

Link to the Complete Response Final Rulehttp://www.fda.gov/cder/regulatory/complete_response_FR/default.htm
Link to the drug approval process pagehttp://www.fda.gov/fdac/special/testtubetopatient/default.htm

Wednesday, November 05, 2008

PRO, CRO, and Laboratory tests / device measurements

In an article by Willke et al (Controlled Clinical Trials, 25, 2004), the study endpoints were classified as three major categories. Endpoints were classified into the following three major categories, and the presence or absence of each of these categories was noted for each product reviewed. Each product may have employed one, two, or all three types of endpoints:

  • Laboratory tests and device measurements,
  • Clinician-reported outcomes (CROs)
  • Patient-reported outcomes (PROs).

Laboratory and device measurements included highly objective typically numerical measures often performed by machine.

Clinician-reported outcomes included those that might be considered traditional endpoints, either observed by the physician (e.g., cure of infection and absence of lesions) or requiring interpretation by the physician (e.g., radiologic results and tumor response). In addition, CROs included both formal and informal scales completed by the physician using information about the patient. CROs requiring patient input are distinguished from clinicianadministered PROs in that the former requires clinician judgment or interpretation when recording answers, while the latter involves recording precise, unmodified patient responses to prespecified questions.

Finally, endpoints classified as patient-reported outcomes included formal health-related
quality of life measures and any other endpoint that was primarily based on a direct patient report. PROs categorized as "formal" scales are those multiitem questionnaires that have a well-defined standardized format, well-documented procedures for administration and scoring, demonstrated reliability and validity, and some guidelines for interpretation of scores. Other PROs included informal symptom scales, patient global assessments, or visual analog scales, as well as patientreported endpoints recorded in event logs (e.g., specific events). In some cases, nonclinician proxies reported the outcome from the perspective of the patient (e.g., when vaccines were tested in infants); these endpoints were considered patient-reported.

Tuesday, November 04, 2008

Declaration of Helsinki and FDA

The newly released Declaration of Helsinki was issued by the 59th World Medical Association General Assembly in October 2008. This document details ethical principles for medical research involving human subjects.

Section 19 requiring every clinical trial to be registered before recruitment of the first subject. Also note Section 30 on the obligation to make public the results of research on human subjects and requirements for publications. The additional contents are in line with the recent push for registry of the clinical studies and publication of the clinical trial results.

http://www.wma.net/e/policy/pdf/17c.pdf
http://www.wma.net/e/index.htm
http://en.wikipedia.org/wiki/Declaration_of_Helsinki

However, the FDA is moving away form the Helsinki accords because of what it says about placebo. The following two links discussed this issue.
http://www.socialmedicine.org/2008/06/01/ethics/fda-abandons-declaration-of-helsinki-for-international-clinical-trials/
In 21 CFR 312, "Human Subject Protection; Foreign Clinical Studies Not Conducted Under an Investigational New Drug Application- Notice of Final Rule", FDA states
" The final rule replaces the requirement that these studies be conducted in accordance with ethical principles stated in the Declaration of Helsinki (Declaration) issued by the World Medical
Association (WMA), specifically the 1989 version (1989 Declaration), with a requirement that the studies be conducted in accordance with good clinical practice (GCP), including review and approval by an independent ethics committee (IEC)."

A article on EMBO report (7(7), 2006) titled "The Battle of Helsinki" is worth to read.

North Carolina's Triangle Business Journal (2/19, Gallagher) reports that "the study also questions the decision by the US Food and Drug Administration in 2008 to abandon the Declaration of Helsinki, a set of standards adopted by the World Medical Association in 1984 that required trials to compare new drugs with the most effective alternative." The Food and Drug Administration "dropped the Helsinki standards in favor of the policy of Good Clinical Practice adopted by the International Conference on Harmonisation of Technical Requirements for Registration of Pharmaceuticals for Human Use. That policy, which allows drug manufacturers to compare the results of the new drug with those of a placebo, is considered by some to be less stringent than the Declaration of Helsinki."

Tuesday, October 07, 2008

Power of words and Safe Communication

Words that end up in court
Altered records, defect, falsification, hazardous, illegal, incompetence, inferior, negligent, reckless, wrongdoing

Fighting words
Allege, argument, complaint, careless, dispute, idiot, inefficient, liable, misinform, problem, shoddy, shortsighted

Loaded questions and negative words
"I am not a cook"
"I am not a bimbo"
How would you respond?
Did the clinical trials go badly?
Do you always drive like a maniac?

Phrases to make people defensive
Apparently you are not aware...
Contrary to your inference...
I don't agree with you...
Let me make this perfectly clear...
You obviously overlooked...
And just for your information...


Phrases that will get you more attention than you want
delete this email
do not distribute
shred this memo
do not tell (insert name here)
can we get away with it?
They'll never find out
I have serious concerns
I don't care what you do
This might not be legal
let's meet to talk about the thing I mentioned last night

Avoiding commenting on potential
Potential liability issues:
Risky way: if we do not conduct the tests I propose, the company could face serious FDA regulatory problems and product liability suits
Safer way: I believe this protocol employs sound research methodologies that will yield scientifically valid data and should be favorably reviewed by the FDA

Be specific and detailed about information sources:
Risky way:Managers send and receive an average of 178 messages a day
Safer way: A recent Gallup poll showed that managers send and receive an average of 178 messages per day

Risky way:Previous studies show the drug is safe
Safer way: According to the 2005 viral transmission study done by Dr. Jackson...

Risky way: He says he won't use our product because the rate of viral transmission of hepatitis C is too high
Safer way: Dr. Bowers had concerns about the possibility of viral transmission of hepatitis C. I explained to him about our...

Close 'open loops'
An open loop
  • The investigator again questioned the safety of the new protocol
Closing the loop
  • In response to the investigator's query about the safety of the protocol...

Know when not to respond
  • when you don't know
  • when it falls outside your expertise area
  • potential hot button issues
  • challenging editors and auditors

Monday, October 06, 2008

Source data in EDC trial

One of my friends asked me what would be the source data and how to verify if the data was directly entered into EDC. A recent article in clinicaltrialsonline.com answered this question. it looks like this is the topic covered under FDA's new guidance "Computerized Systems Used in Clinical Invesitgations" http://www.fda.gov/cder/guidance/7359fnl.htm.

Scenario 1: Data are first captured on paper and then manually entered into a computerized system. Source data are the paper documents. Examples: Data collected at clinical sites, IRBs, and medical practices.

Scenario 2: Data are first captured electronically into a computerized system and then manually entered into another database. Source data are the electronic records in the computerized system. Examples: Data collected at clinical sites, diagnosis after test evaluation in medical institutions.

Scenario: 3: Data are first captured electronically into a computerized system. Source data are the electronic records in the computerized system. Examples: Data collected at clinical sites, clinical laboratories, analytical laboratories, etc.

To read the full article, please visit "http://appliedclinicaltrialsonline.findpharma.com/appliedclinicaltrials/article/articleDetail.jsp?id=546112&sk=&date=&pageID=3"

New Data Management acronyms

The recent effort to standardize the clinical data acquisition results in a lot of new acronyms. Some of them are listed below. A lot of these terms are in CDISC standards http://www.cdisc.org/standards/index.html

CDASH - Clinical Data Acquisition Standards Harmonization – Data acquisition (CRF) standards
CDISC - Clinical Data Interchange Standards Consortium http://www.cdisc.org
ODM - Operational Data Modeling – CDISC trasnpport standard for acquisition, exchange, submission (define.xml) - http://www.cdisc.org/models/odm/v1.1/odm1-1-0.html
SDTM - Study Data Tabulation Model - http://www.cdisc.org/models/sds/v3.1/index.html
SDS - Submission Data Standards - http://www.cdisc.org/models/sds/v2.0/
SEND - Standard for Exchange of Nonclinical Data
ADaM - Analysis Dataset Model
EDC- Electronic Data Capture
RDC - Remote Data Capture
CTD - Common Technical Document
eCTD - electronic Common Technical Document

Adobe Acrobat Resource Center - weblinks

Training & Resources:
Acrobat for life sciences blog - http://blogs.adobe.com/acrobatforlifesciences/
Acrobat legal links online - https://www.regonline.com/builder/site/default.aspx?eventid=136003
Adobe solutions for life sciences website - http://www.adobe.com/lifesciences/
Adobe and the SAFE-Biopharma Association - http://www.adobe.com/lifesciences/safe.html
SAFE white paper - http://www.adobe.com/lifesciences/pdfs/safe_wp.pdf
Adobe solutions for electronic submissions solution brief - http://www.adobe.com/lifesciences/pdfs/electronic_submissions_sb.pdf

Support & Development
Adobe PDF for Developers Blog - http://blogs.adobe.com/pdfdevjunkie/
Acrobat 8 deployment techniques eSeminar - https://admin.adobe.acrobat.com/_a227210/p92416557
Adobe Support Knowledgebase, Join the acrobat forum and the acrobat user group - http://adobe.com/support
Free acrobat tutorials, user groups, and blogs - http://www.adobe.com/cfusion/designcenter/search.cfm?product=acrobat&term=acrobat&topic

Free Download & Trials
Adobe 8.0 Professional Free Trial Download- http://www.adobe.com/products/acrobatpro/tryout.html
Adobe document center free trial - http://www.adobe.com/products/onlineservices/documentcenter/features.html
ISItoolbox pharma edition free trial - http://www.isitoolbox.com/ProductInformatoin/PharmaEdition/tabid/724/Default.aspx

Sunday, October 05, 2008

Introduction to pharmacokinetics and pharmacodynamics

The book by Drs Tozer and Rowland is pretty good.
About dose "To paraphrase Paracelsus, who lived some 500 years ago, "all drugs are poisons, it is just a matter of dose." A dose of 25 mg of aspirin does little to alleviate a headache; a dose closer to 300-600 mg is needed, with little ill effect. However, 10 g taken all at once can be fatal, especially in youn children.

About the definition of PK and PD: In simple terms pharmacokinetics may be viewed as what the body does to the drug, and pharmacodynamics as what the drug does to the body.

On genetic variability in drug response: If we were all alike, there would be only one dose strength and regimen of a drug meeded fro the entire patient population. But we are not alike; we often exhibit great interindividual variability in repsonse to drugs. In rare caes, the "one-dose-for-all" idea, suffices.

About Plasma: In practice, plasma is preferred over whole blood primarily because blood causes interference in many assay techniques. Plasma and serum yield essentially equivalent drug concentrations, but plasma is considered easier to prepare because blood must be allowed to clot to obtain serum. During this process, hemolysis can occur, producing a concentration that is neither that of plasma nor blood, or causing an inference in teh assay.

About the differences among Plasma, Serum, and Whold Blood:
Plasma: Whole blood is centrifuged after adding an anticoagulant, such as heparin or citric acid. Cells are precipitated. The supernate, plasma, contains plasma proteins that often bind drugs. The plasma drug concentration includes drug-bound and unbound to plasma proteins.
Serum: Whole blood is centrifuged after the blood has been clotted. Cells and material forming the clot, including fibrinogen and its clotted form, fibrin, are removed. Binding of drugs to fibrinogen and fibrin is insignificant. Although the protein composition of serum is slightly different from that of plasma, the drug concentrations in serum and plasma are virtually identical.
Whole blood: whoe blood contains red blood cells, white blood cells, platelets and various plasma proteins. An anticoagulant is commonly added and drug is extracted into an organic phase often after denaturing the plasma proteins. The blood drug concentration represents an average over the total sample. Concentrations in the various cell fractions and in plasma may be very different.

On site of administration:
Intravascular: refers to the placement of a drug directly into the blood - either intravenously or intra-arterially.
Extravascular: include the intradermal, intramuscular, oral, pulmonary (inhalation), subcutaneous (into fat under skin), rectal, and sublingual (under the tongue) routes.
Parenteral administration: refers to administration aprat from the intestines. Parenteral administration includes intramuscular, intravascular, and subcutaneous routs. Today, the term is generally restricted to those routes of administration in which drug is injected through a needle. Thus, although the use of skin patches or nasal sprays (for systemic delivery) are strictly forms of parenteral administration, this term is not used for them.

Friday, September 12, 2008

Target Product Profile

Target Product Profile (TPP) is a new concept to me. However, it may not be a new term at all. Recently, I was asked to review a TPP and I searched the website to find out what TPP means and what are included in TPP. The description of the clinical development programs has to include some information related to biostatistics such as what to measure (primary or secondary endpoint), what the expected treatment difference, how many subjects we need...... Below is a description about TPP cited from a white paper (http://www.diahome.org/content/community/TPP_White_Paper.doc). While TPP is typically used for better communication with regulatory authorities, it may also be used in other purpose. For example, WHO had a TPP for the Advance Market Commitment (AMC) for Pneumococcal Conjugate Vaccines (http://www.who.int/immunization/sage/target_product_profile.pdf).

"A Target Product Profile (TPP) is a document, prepared by the sponsor, to facilitate clinical drug development and enhance constructive dialogue between the sponsor and reviewing Division at the Food and Drug Administration (FDA). A TPP is written and updated during the investigational phases of development in order to capture the goals of clinical drug development as statements of proposed claims for a prescription drug or biologic product. In the TPP, each proposed claim should be annotated to the specific study or other source of data that is intended to support the key sections and statements in the TPP. In essence, the TPP embodies the notion of "beginning drug development with the end in mind"; that is, the sponsor specifies the proposed claims that are the goals of drug development, documents the specific studies that are intended to support the key claims, and then uses the TPP to facilitate a constructive dialogue with FDA."

FDA actually had a draft guidance on TPP (http://www.fda.gov/CDER/GUIDANCE/6910dft.htm)

The garget product profile, if utilized during the development phases, should facilitate labeling discussions during the review cycle. Labeling discussions will be further enhanced if the applicant and FDA provide their rationale for key elements or proposed changes in drfat labeling. To pursue this principle, the applicant and FDA will provide verbal or written rationale for revisions to draft labeling.

Tuesday, August 19, 2008

adverse events temporally associated with infusion

In biological field, it is pretty common to collect and analyze the adverse events that are temporally associated with an infusion. For example, this is required in a recent FDA guidance about IGIV (http://www.fda.gov/cber/gdlns/igivimmuno.pdf). The guidance stated “Your protocol should define criteria for establishing an AE as an infusional AE (i.e., an AE temporally associated with an infusion). We recommend you list AEs individually by body system with subject identification numbers and report the overall incidences of all AEs that occur during or within: (a) 1 hour, (b) 24 hours, and (c) 72 hours following an infusion of test product, regardless of other factors that may impact a possible causal association with product administration.”

While this is understandable, we need to be clear about the exact time frame for collecting these AEs when coming to the programming. I had a couple of studies where the definition (therefore the calculation) of the infusion related adverse events are defined differently “Infusion related adverse events are defined as any event that occurs within 1 hour, 24 hours, or 72 hours of initiation of the study drug infusion.” While this is not wrong, the time frame is shorter for counting the infusion related adverse events.

To be crystal clear about the time period where the infusion related AEs are collected, the following sentence seems to be better.

“The incidence of adverse events considered potentially related to Flebogamma 5% DIF during or within 72 hour after completing an infusion…” (refer to http://www.ncbi.nlm.nih.gov/pubmed/17909953?ordinalpos=1&itool=EntrezSystem2.PEntrez.Pubmed.Pubmed_ResultsPanel.Pubmed_RVDocSum

Monday, August 18, 2008

Quantile regression


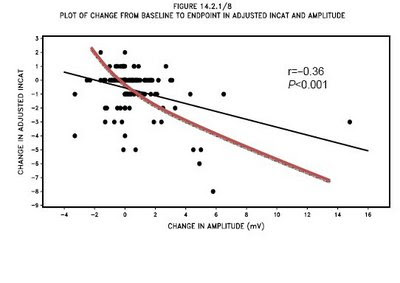
Typically, the physicians will listen to statisticians for statistical analysis approaches. In some cases, the physicians can be very smart and knowledgable in statistics. In a recent discussion about exploring the correlation between change in INCAT (a scale for measuring the functional disability) and change in amplitude (a neurophysiology measure), I performed the simple correlation and calculated the Pearson's correlation coefficient. The scatter plot with fitted linear regression line were shown on the right side figure. One of the investigators pointed out that the correlation line drawn in the figure is not the maximum we can get out of it. He think that a curvilinear fitting may be better.

Through his reminder, I refit the data using spline fitting by adding quadratic term and/or cubic terms to the linear regression, the result is no better. I also learned the new regression approach, quantile regression. It turned out that the quantile regression is similar to the linear regression, but is trying to minimize the distance between the observed value and the quantile (median, 75th quantile,...) instead of minimizing the distance between the observed value and the mean. The SAS actually provided an experimental version of Quanreg procedure. The procedure can be downloaded from SAS website for free. http://support.sas.com/rnd/app/da/quantreg.html.

http://www2.sas.com/proceedings/sugi30/213-30.pdf

For my question, the quantile regression is not better than the linear regression or simply correlation.

Friday, July 18, 2008

Some words about adaptive design

Four rules to adapt by:
  • Allocation rule: how subjects will be allocated to the avaialble arms
  • Sampling rule: how many subjects will be sampled in subsequent stages
  • Stopping rule: when to drop an arm or stop the trial (for efficacy, harm or futility)
  • Decision rule: the final decision and interim decisions pertaining to design changes not covered in the previous three rules. Examples of the modifications that can result from these decision-making rules include modifying the sample size, dropping a treatment arm, stopping a study early for success or failure, combining phases, and/or adaptive randomization

Adaptive trials can involve any one of these rules, or a combination of them

Top three misconceptions of adaptive trials:
  • There are certain areas of confirmatory clinical research where adaptive designs are more applicable and other areas where adaptive designs are less or not applicable
  • Adaptive trial designs are characterized by unmanageable complexity and less careful planning
  • Adaptive designs require smaller sample sizes than traditional designs

Human beings lean toward wishful thinking. On average, drug effects are overestimated and the variability of drug effects is underestimated. As yet, trials have either been unknowingly underpowered or intentionally overpowered. In the latter case, an adaptive design is more or less unnecessary (aside from the questionable ethics of overpowered trials). The unknowingly underpowered trials, however, is where adaptive designs come into plan. By using an adaptive design, a potentially underpowered trial can be rescued. Overall, adaptive designs make better use of the patient as a resource. Trials no long need to be overpowered, and the number of underpowered trials is rescued.

Thursday, July 17, 2008

The heavy burden of the modern clinical trial protocols

A recent article by Mr Getz in Applied Clinical Trials elaborated the heavy burden of protocol design in modern clinical trials. The clinical trial design become more and more complicated, requiring more study procedures, collecting more items. More complex and demanding protocols are hurting clinical trial performance and success.

I absolutely agree with his assessment. I can even add that the protocol design may also require more blood draws from the participants for hematology, chemistry, viral testing, biomarkers, pharmacokinetics, pharmacogenetics,… In some studies, patients may be exposed to more radio material exposures than ever. I even heard that a sponsor provided a comprehensive protocol with adaptive study design with many pages of appendices to describe how Bayesian algorithms are applied. We can imagine the reaction from investigator, CRA, even CRO statisticians. I don’t know how the investigator can understand these Bayesian algorithms. One question that needs to be answered is the target of the study protocol: is it for investigators? For regulatory authorities? For IRBs? For CRAs? Or for all of them?

Everything has a balance. Eventually we will get to a point that a too complex and too demanding protocol may actual hurt the study from every aspect in terms of the cost, resource, patient enrollment, data quality, generalization of the study results,…

Who to blame? I can think of the followings:
Regulatory requirement is getting tighter and tighter.
The sponsor is getting more conservative
The sponsor is trying to collect as much information as they can with no distinguishing of the items that are really necessary and the items that is merely nice to have.
Key opinion leaders are often asking for additional items to be added to the protocol for their own interest.

Wednesday, July 16, 2008

Communication with non-statisticians

My fellow colleague expressed his frustration about exlaining a statistical concept to our clinical operation colleagues. I fully undertood his feelings. Sometimes, it is not easy to communicate with non-statisticians. The problem could be on both sides: stastician did not use the plain English or non-statisticians lacked the understanding of very basic statistics.

Considering my medical background, I feel a little lucky when communicating with physicians or non-statisticians. Perhaps also because of my teaching experience, I knew how to explain the complicated statistical issues in plain language to the non-statisticians. So I have one area I am proud of myself.

Below I picked up an example to demonstrate how differently the statistical terms can be explained.

Regarding three types of missing data mechnisms, here are the definition from a recent article in Drug Information Journal:
  • Data are considered missing completely at random (MCAR) if, conditional upon the independent variables in the analytic model, the missingness does not depend on either the observed or unobserved outcomes of the variable being analyzed (Y)
  • Data are missing at random (MAR) if, conditional upon the independent variables in the analytic model, the missingness depends on the observed outcomes of the variable being analyzed (Yobs) but does not depend on the unobserved outcomes of the variable being analyzed (Ymiss).
  • Data are missing not at random (MNAR) if, conditional upon the independent variables in the analytic model, the missingness depends on the unobserved outcomes of the variable being analyzed.
Now, for the same concept, the following definitions seem to be better understandable.
  • MCAR (data are missing completely at random): A "missing" value does not depend on the variable itself or on the values of other variables in the database.
  • MAR (data are missing at random): The probability of missing data on any variable is not related to its particular value. The pattern of missing data is traceable or predictable from other variables in the database.
  • NMAR (not missing at random): Missing data are not random and depend on the values that are missing.

Sunday, July 13, 2008

Rule of three

Rule of three states that consider a Bernoulli random variable with unknown probability p, if in n independent trials no events occur, a quick-and-ready approximation to the upper 95% confidence bound for p is 3/n.
This rule has particularly been used in pre-licensure clinical trials where the adverse event rate is very rare. Sample sizes of pivotal trials for licensure are set for an efficacy endpoint, and vary according to the indication. Therefore, pivotal confirmatory studies provide adequate denominators for determining adverse events that occur at a frequency higher than or similar to the clinical efficacy outcome. However, sample sizes are not sufficient for detecting the rare events. Only reliable post-marketing surveillance systems will allow detection of a rare adverse event or a small increase in adverse event rate.
Rule of three provides a quick calculation of the upper confidence interval of the observed rate (observed rate is zero when there is no event occurred). It is based on the estimated upper limit of the 95% confidence interval when this particular event has not occurred during a clinical trial or during the clinical development program. As an example in vaccine development program, if no event has been observed with a sample size of 100, the upper limit of the 95% CI of the rate of this event is 3%. A sample size in the range of 10 000 subjects can be considered adequate for establishing the protective efficacy of a new vaccine. If no event of any particular sort has been observed during a pre-licensure clinical program involving 10 000 individuals, it can be estimated that this event rate has an upper limit of 3 per 10 000. Rarer adverse events, those occurring at a lower frequency than the vaccine-targeted disease, or an increase in rare adverse events, are unlikely to be detected before licensure their assessment must rely on post-marketing studies (phase IV).
However, if the rare event does occur during the clinical trial (the event rate is not zero), the rule of three should not be used. Instead, the confidence interval should be calculated according to exact or permutation approach (not the formula that is based on the normal approximation).

Also, we should not attempt to calculate the sample size based on the rule of three. The sample size should still be based on the efficacy endpoint instead of the comparison of the rare events – otherwise, the sample size could be huge.

References:
1. Ernst Eypasch et al. Probability of adverse events that have not yet occurred: a statistical reminder. BMJ 1995
2. Steve Simon's web blog. Stistical confidence interval with zero event

Sunday, July 06, 2008

Comparing treatment difference in slopes

In regulatory setting, can we showing the treatment difference by comparing the slopes between two treatment groups?
In a COPD study (e.g., a two arm, parallel group with primary efficacy variable measured at baseline and every 6 months thereafter), one can fit the random coefficient model and compare the treatment difference between two slopes. Also we can compare the treatment difference in terms of change from baseline to the endpoint (the last measure).
To test the difference in slopes, we would need to test whether or not the treatment*time interaction term is statistically significant. The assumption is that at the beginning of the trial, the intercept for both groups are the same - both groups started at the time level. Then if the treatment can slow the disease progression, the treatment group should show a smaller slope comparing with the placebo group.
If all patients are followed up to the end of the study, if the slopes are different, the endpoint (change from baseline) analysis should also be statistically different. However, with a smaller sample size, the results could be inconsistent by using slope comparison approach vs. endpoint analysis approach. For a given study, the decision has to be made which approach is considered as the primary endpoint. Why don't we analyze the data using both approaches? then we have to deal with the adjustment for multiplicity issue.
I used to make a comment and say "some regulatory authorities such as FDA recommend the simpler endpoint analysis"; then I was asked to provide the references to suport my statement. I did quite extensive search, but I could not find any real relevant reference. However, by reviewing 'statistical reviews' in the BLA and NDA in US, it is very rare to see any product approval based on the comparison of the slopes. Many product approvals are based on the comparison of 'change from baseline'.
So this is really a regulatory question. Every indication has their accepted endpoints so tradition takes precedence. According to my colleague, there is a movement in the Alzheimer's arena to look at differences in slopes, but this is basedon trying to claim disease modification. If this is the case, we may also apply this to the COPD area since for certain type of COPD, we can claim the disease modification by showing the differences in slopes.been used in COPD before?
On the other hand, It seems that that the slope model (random coefficient model) may be preferred in academic setting, but endpoint approach - change from baseline (with last value carried forward) may be more practical in the industry setting.
From statistical point of view, the slope approach makes a lot of sense, however, we need to be cautioned about some potential issues: 1. In some endpoint measure, there may be some type of plateau. If you reach that plateau prior to the end of the study there will be a loss of power comparing slopes as compared to some comparison of just the endpoint results or some type of general repeated measures assessment of the average treatment difference.2. If the slope comparison is used as the primary efficacy measure, the # of measurements per year on the primary efficacy variable is relevant. One may think that the more frequent measures will increase the power to show the treatmetn difference in slopes. The question arise when designing the study: are you choose a shorter trial with more frequent measures? or are you choose a longer trial with less frequent measures?

Saturday, July 05, 2008

Geometric Statistics, geometric CV, intra-subject variation


In bioavailability and bioequivalence studies, the pharmacokinetic parameters (AUC, Cmax) are often assumed to follow the log normal distribution. Further about log-normal distribution.


The common technique is to calculate the geometric statistics (geometric mean, geometric CV and geometric SD). Notice that the geometric CV is independent of the geometric mean (unlike the arithmetic CV which is dependent on the arithmetic mean) and the geometric CV is used in the sample size calculation. When calculating the geometric statistics, the data in original scale is log-transformed, then anti-log to transform back.


In crossover design, the geometric CV can be estimated from the mixed model and is used to gauge the intra-subject variation. Geometric CV = sqrt(exp(std^2)-1) or CV=sqrt(exp(variance)-1) where the std^2 is estimated by the MSE. Variance is from ODS ‘CovParms’ table of SAS PROC MIXEd. Another variation is inter-subject CV and the std^2 is estimated by the variance estimate for the random subject effect from the proc mixed procedure.


It should be cautioned that Geometric CV sometimes is just being called CV or intra-subject variability. I heard that some large pharmaceutical companies include 'intra-subject variability' in the standard data presentation for pharmacokinetic parameters.


The topic about the CV, geometric CV was discussed in Boomer.org (http://www.boomer.org/pkin/PK06/PK2006512.html), a discussion mailing list on bioavailability and bioequivalences. Boomer.org used to be a great resource for PK-related discussion. However, recently the discussion group was dominated by a lot of the junkies posted by Indian guys. I guess it is because of the booming generic drug development industry in India.


Friday, July 04, 2008

Good Clinical Practice: A question & answer reference guide

I recently find the book edited by Parexel is extremely useful.

Good Clinical Practice: A Question & Answer Reference Guide
Edited by Mark P. Mathieu, Parexel Internationl Corporation
http://www.barnettinternational.com/ or
http://www.barnettinternational.com/EducationalServices_Publication.aspx?p=6544

Due to the fact that I work side by side with study managers and medical directors and due to my responsibility of overseeing the data management activities (outside of my responsibilities for biostatistics), I am involved in a lot of discussions the data collection, data quality. In a lot of situations, the decision has to be made on whether or not an event should be collected as an adverse events or how an event should be collected, ......

The Good Clinical Practice is just like the law. A lot of guidances really depends on how to interpret. The book of "A Question & Answer Reference Guide" is the one attempting to provide the interpretation of the GCPs with practical questions.

Here are two exmamples extracted from this book:

Q. Assuming that it is a study exclusion criterion, is a pregnancy while on study considered an AE? Is it considered an SAE?
A. In and of itself, a pregnancy is not considered an AE or SAE. However, abortion, whether accidental, therapeutic, or spontaneous, should always be classified as a SAE and expeditiously reported to the sponsor. Similarly, any congenital anomaly/birth defect in a child born to a female subject exposed to the investigational product should be recorded and reported as an SAE.
…..

Q. should expected clinical outcomes of the disease under study, which are efficacy endpoints, be reported as AEs/SAEs?
A. Some protocols instruct investigators to record and report all untoward events that occur during a study as AEs/SAEs, which could include common symptoms of the disease under study and/or other expected clinical outcomes. This approach enables frequency comparisons of all events between treatment groups, but can make event recording in the CRF burdensome, result in more expedited reports from investigators to sponsors, and fill safety database with many untoward events that most likely have no relationship to study treatment and that could obscure signal identification.
In some clinical trials, disease symptoms and/or other expected clinical outcomes associated with the disease under study, which might technically meet the ICH definition of an AE or SAE, are collected and assessed as efficacy parameters rather than safety parameters.
.....

==========
Recently, We have a study where several subjects had elective procedures (breast augmentation, mole removal,...). To show the diligence, we might be tempted to consider them as adverse events (even though they are not drug related), however, the elective procedures should not be considered as adverse events. These elective procedures can be collected on a separate CRF page, but should not be reported in AE page.

The best way is to specify the detail either in the study protocol or in the initial training provided to the investigational sites prior to the study start so that the same criteria are followed and all investigators are clear what should be reported and what should not be reported.

Are we become slaves of the Intent to Treat Principle?

The intent to treat (or intention to treat) principle was invented by the statistician about 30 years ago. It took a while for the clinical trial community to accept the this concept. Nowadays, the intent to treat principle has been well accepted by the people well beyond the statisticians. However, I don't think everybody really understand the concept even though he (or she) may mention the intent to treat pricinple every time he (or she) can. I have been really bothered by the comments from regulatory reviewers to suggest us to define an intent to treatment population for studies without randomization and without placebo or active control (for example, a dose escalation study). We seem to become slaves of the intent-to-treat.

In a lot of situations, the intent to treat principle is misunderstood. The intent-to-treat concept is tied with randomization for treatment allocation. No randomization, no Intent-to-treat.
The intent-to-treat concept is really for the large scale, confirmatory, pivitol studies. For very ealier stage studies (for example, the dose escalation studies) with very few subjects, there is no need to follow the intent-to-treat principle.

Intent to treat population includes all randomized patients in the groups to which they were randomly assigned, regardless of their adherence with the entry criteria, regardless of the treatment they actually received, and regardless of subsequent withdrawal from treatment or deviation from the protocol. Stricly according to the intent to treat principle, if a subject is randomized, but never receive study medication, the subject would be included in the statistical analysis; if a subject is randomized to drug A, but wrontly takes the drug B, the subject would be analyzed in treatment group A, not B (so called as randomized, not as treated); if a subject is randomized, but with no outcome measures, the subject would be included in the analysis with subject considered as treatment failure.

Intention to treat analyses are done to avoid the effects of crossover and drop-out, which may break the randomization to the treatment groups in a study. Intention to treat analysis provides information about the potential effects of treatment policy rather than on the potential effects of specific treatment.

To apply the intent to treat principle, an appropriate method for handling the missing data needs to be specified. A popular practical approach (not idea approach from statistical standpoint) is last value carried forward.

Intent to treat principle is not needed for all clinical trials and should not be interpreted as "include all enrolled subjects" or "all subjects who signed informed consent". The intent to treat is from the randomization standpoint, it has nothing to do with "study subject has intention to be treated in the clinical trial".

References:
1. ICH guidance E9 http://www.fda.gov/cder/guidance/ICH_E9-fnl.pdf
2. My presentation on ITT vs mITT http://webspace.webring.com/people/eu/um_3826/ITT_mITT_JSM2004.ppt
3. Wikipedian http://en.wikipedia.org/wiki/Intention_to_treat_analysis

Sunday, June 15, 2008

Calculation of length of the study drug exposure

We have been using the following formula in calculating the length of the study drug exposure in many studies:

# of days of drug exposure = the last dose date - the first dose date + 1

However, this seems to be correct only if the subject receive daily dose of the study medication. We have many studies where the subject receive weekly infusion or every three weeks infusion of the study medication. In this situation, the above formula will underestimate the length of the study drug exposure.

The correct formula should be tied up with the dose interval.

If a subject receive weekly dose, the formula would be:
# of days of drug exposure = the last infusion date - the first infusion date + 7
or
# of weeks of drug exposure = (the last infusion date - the first infusion date + 7)/7

If a subject receive study drug every three weeks, the formula would be:
# of days of drug exposure = the last infusion date - the first infusion date + 21
or
# of weeks of drug exposure = (the last infusion date - the first infusion date + 21)/7

Saturday, June 14, 2008

An early clinical trial with N=2

In the late 18th century, King Gustav III of Sweden decided that coffee was poison and ordered a clinical trial.
  • The King condemned a convicted murderer to drink coffee every day.
  • The control was another murderer who was condemned to drink tea daily.
  • The outcome measure is 'death'.
  • Two physicians were appointed to determine the outcome.

Results:
  • The two doctors died first
  • The king was murdered
  • Both convicts enjoyed long life until the tea drinker died at age 83. (no age was given for the coffee drinker)

J Int Med. Oct 1991:289 - introduction to editorial from Nordic School of Public Health, Goteborg Sweden

Reprinted in Annal of Internal Medicine 1992: 117:30

Lack of clinical equipoise

Clinical equipoise provides the ethical basis for conduct of randomized clinical trials. This principal states that a clinical trial is acceptable only insofar as there is professional disagreement between researchers concerning uncertainty regarding the outcome of the study.1and thus even if a clinician prefers one arm over another, randomization is still sound when there are others who believe the other way around.

However, there are often different opinions between regulatory and investigator regarding the interpretation of equipoise and biases generated from publications suggestive of the efficacy of one product over another may cause lack of equipoise. Lack of clinical equipoise causes unwillingness at the investigator level to enroll patients because of strong belief by the majority of physicians in one treatment being superior over another. This results in difficultly in designing studies to support licensing a product such that physicians are unwilling to participate in a study that is necessary to satisfy regulatory agency(s) requirements for trial data demonstrating efficacy and safety.


References:
Freedman B: Equipoise and the ethics of clinical research. N Engl J Med 317: 141-145, 1987
Lilford RJ Declaratio of Helsinki should be strengthened. BMJ 322(7281) 299
Ashcroft R: Equipoise, knowledge and ethics in clinical research and practice. Bioethics 13 (3/4):314-326, 1999
Royall RM: Ethic and Statistics in Randomized Clinical trials. Statistical science 6(1): 52-66 1991

Monday, March 24, 2008

Phase 0 clinical trial

Traditionally, we have been talking about the phase I to phase IV clinical trials in drug development. We start from the small trials in healthy volunteers (phase I) to dose finding or proof of concept (POC) trials (phase II) to pivotal trials (Phase III), the post-marketing trial (Phase IV). Or we start from trials for MTD (maximal tolerable dose) - Phase I to trials for MED (minimal effective dose) - Phase II. Now there comes a new phase of clinical trial - Phase 0.
According to wikipedia, "Phase 0 is a recent designation for exploratory, first-in-human trials conducted in accordance with the U.S. Food and Drug Administration’s (FDA) 2006 Guidance on Exploratory Investigational New Drug (IND) Studies.[7] Phase 0 trials are also known as human microdosing studies and are designed to speed up the development of promising drugs or imaging agents by establishing very early on whether the drug or agent behaves in human subjects as was anticipated from preclinical studies. Distinctive features of Phase 0 trials include the administration of single subtherapeutic doses of the study drug to a small number of subjects (10 to 15) to gather preliminary data on the agent's pharmacokinetics (how the body processes the drug) and pharmacodynamics (how the drug works in the body).
A Phase 0 study gives no data on safety or efficacy, being by definition a dose too low to cause any therapeutic effect. Drug development companies carry out Phase 0 studies to rank drug candidates in order to decide which has the best PK parameters in humans to take forward into further development. They enable base go/no go decisions to be based on relevant human models instead of relying on animal data, which can be unpredictive and vary between species."

While the term 'phase 0' is fancy and novice, the usefulness of phase 0 trials needs to be proved in the future. At this point, I guess it is just a concept from governmental agencies such NCI (national cancer institute). I doubt that the industry will really be interested in this Phase 0 trial.