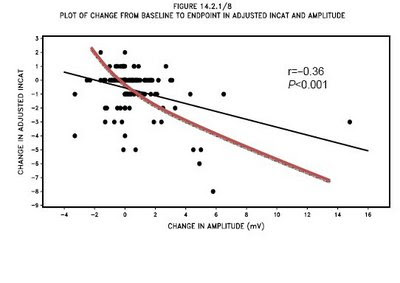
Typically, the physicians will listen to statisticians for statistical analysis approaches. In some cases, the physicians can be very smart and knowledgable in statistics. In a recent discussion about exploring the correlation between change in INCAT (a scale for measuring the functional disability) and change in amplitude (a neurophysiology measure), I performed the simple correlation and calculated the Pearson's correlation coefficient. The scatter plot with fitted linear regression line were shown on the right side figure. One of the investigators pointed out that the correlation line drawn in the figure is not the maximum we can get out of it. He think that a curvilinear fitting may be better.
Through his reminder, I refit the data using spline fitting by adding quadratic term and/or cubic terms to the linear regression, the result is no better. I also learned the new regression approach, quantile regression. It turned out that the quantile regression is similar to the linear regression, but is trying to minimize the distance between the observed value and the quantile (median, 75th quantile,...) instead of minimizing the distance between the observed value and the mean. The SAS actually provided an experimental version of Quanreg procedure. The procedure can be downloaded from SAS website for free. http://support.sas.com/rnd/app/da/quantreg.html.
http://www2.sas.com/proceedings/sugi30/213-30.pdf
For my question, the quantile regression is not better than the linear regression or simply correlation.
No comments:
Post a Comment