In statistics, a confidence interval (CI) is a type of interval estimate of a population parameter. Confidence intervals consist of a range of values (interval)
that act as good estimates of the unknown population parameter; however,
the interval computed from a particular sample does not necessarily include the
true value of the parameter. It has been a normal practice that when a point
estimate is calculated and a p-value is presented, the confidence interval will
also be provided. If a corresponding hypothesis test is performed, the
confidence level is the complement of the level of significance i.e. a 95%
confidence interval reflects a significance level of 0.05. Confidence intervals are typically
stated at the 95% confidence level that is corresponding to the significance
level of 0.05. Confidence intervals may also be presented as 90% or 99% that is
corresponding to the significance level of 0.10 or 0.01. It will be odd if the constructed confidence
interval is not in 90%, 95%, or 99%. It is odd to present a confidence interval
of 97.31%.
The significant levels should match the confidence
levels. That is why we usually say “corresponding xx% confidence interval”. If
the significance level is 0.05, the corresponding confidence interval should be
95%. If the significant level is 0.01, the corresponding confidence interval
should be 99%.
Issue arrives when we present the confidence interval for studies with interim analyses. To maintain the experimental wise alpha level at 0.05, with interim analysis, the final analyses will be tested at a significant level that is less than 0.05 and could be a number not commonly used otherwise. For example, with an interim analysis at 50% of information available, the significant level for interim analysis should be 0.005 and the significance level for the final analysis should be 0.048 (based on O'Brien Fleming method). Now the corresponding confidence interval will be an odd number of 95.2%.
This is exactly what was done in COMPASS-2 study “Bosentan added to sildenafil
therapy in patients with pulmonary arterial hypertension” (ERJ, 2015). Because of the interim analysis, the alpha level for the final analysis is 0.0269. To match the alpha level, the study presented a 97.31% confidence interval. The article stated the
following (note: I believe that it is pre-planned unblinded interim analysis,
not blinded interim analysis in the sentence below):
With an overall study-wise Type I error (alpha) set to 0.05 (two-sided) based on the log-rank test, when adjusted for two pre-planned blinded interim analyses at 50% and 75% of the target number of primary end-point events, the alpha for the final analysis of the primary end-point was 0.0269 and, thus, 97.31% confidence intervals were used in reporting the HRs.However, presenting a 97.31% confidence interval is odd (even though it is correct). In majority of the publications, the confidence interval were presented not according to their adjusted significance level due to the interim analysis. Here are several articles describing the studies with interim analysis and alpha-spending. The final analysis were tested at a significance level less than 0.05. However, no matter what the significance level was, the confidence interval was always presented as 95% confidence interval.
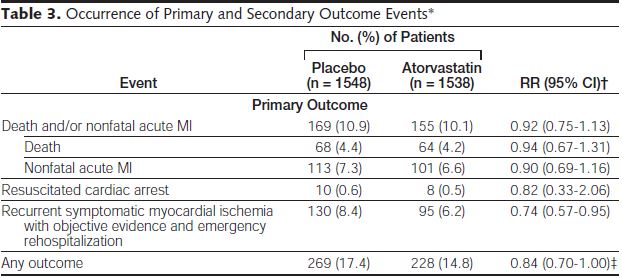
In an article by Schwartz et al (JAMA 2001) “Effects
of atorvastatin on early recurrent ischemic events in acute coronary syndromes:
the MIRACL study: a randomized controlled trial”,
“the study protocol specified 3 interim analyses of safety and efficacy by the
data safety monitoring board. A significance level of p=0.001 was used for each
interim analysis, with a significance level for the final analysis adjusted to
P=0.049 to preserve to the overall type I error rate at P=0.05”. However the
results were presented with 95% confidence interval instead of 95.1%.
In an article by Combs et al (AJOG, 2011) “17-hydroxyprogesterone caproate for twin pregnancy: a double-blind, randomized clinical trial”, two interim analyses were performed and the primary efficacy endpoint was tested at alpha=0.0466, however, the 95% confidence interval was presented anyway.
“Interim analyses of the primary outcome were planned upon completion of 50% and 75% of the case reports. Only the first of these was actually performed. By the time 75% of the patients had delivered and case report forms had been completed, all but 8 of the planned total of 240 subjects had been enrolled and the data and safety monitoring board determined that a second interim analysis would have been moot. To correct for the interim analysis, the alpha level for the primary outcome was adjusted to 0.0466 based on the O’Brien-Fleming spending function. For all other analyses, no adjustments were made and an alpha level of 0.05 was used.”

In an article by Reck et al (NEJM, 2016) “Pembrolizumab versus Chemotherapy for PD-L1-Positive Non-Small-Cell Lung Cancer”, there is a lengthy discussion about the alpha level adjustment for interim analysis (see below), however, all results were presented with 95% confidence interval no matter what the alpha level is.
The overall type I error rate for this trial was strictly controlled at a one-sided alpha level of 2.5%. The full statistical analysis plan is available in the protocol. The protocol specified two interim analyses before the final analysis. The first interim analysis was to be performed after the first 191 patients who underwent randomization had a minimum of 6 months of followup; at this time, the objective response rate would be analyzed at an alpha level of 0.5%. The primary objective of the second interim analysis, which was to be performed after approximately 175 events of progression or death had been observed, was to evaluate the superiority of pembrolizumab over chemotherapy with respect to progression-free survival, at a one-sided alpha level of 2.0%. If pembrolizumab was superior with respect to progression-free survival, the superiority of pembrolizumab over chemotherapy with respect to overall survival would be assessed by means of a group-sequential test with two analyses, to be performed after approximately 110 and 170 deaths had been observed. We calculated that with approximately 175 events of progression or death, the trial would have 97% power to detect a hazard ratio for progression or death with pembrolizumab versus chemotherapy of 0.55. At the time of the second interim analysis, the trial had approximately 40% power to detect a hazard ratio for death with pembrolizumab versus chemotherapy of approximately 0.65 at a one-sided alpha level of 1.18%.
The second interim analysis was performed after 189 events of progression or death and 108 deaths had occurred and was based on a cutoff date of May 9, 2016. The data and safety monitoring committee reviewed the results on June 8, 2016, and June 14, 2016. Because pembrolizumab was superior to chemotherapy with respect to overall survival at the prespecified multiplicity adjusted, one-sided alpha level of 1.18%, the external data and safety monitoring committee recommended that the trial be stopped early to give the patients who were receiving chemotherapy the opportunity to receive pembrolizumab. All data reported herein are based on the second interim analysis.
In an article by Rinke et al (J
Clin Oncol 2009) “Placebo-Controlled,
Double-Blind, Prospective,
Randomized Study on
the Effect of Octreotide LAR in the Control of Tumor Growth in Patients With
Metastatic Neuroendocrine Midgut Tumors: A Report From the PROMID Study Group”, the alpha level
is 0.0125, but the results were presented with 95% confidence interval.
On the basis of previous results, a median time to tumor progression of 9 months was assumed for the placebo group. An HR of 0.6 was postulated as a clinically meaningful difference to be detected with a power of 80%. An optimized group sequential design, with one interim analysis after observation of 64 progressions and the final analysis after observation of 124 progressions, with a local type I error level of 0.0122 at interim, was fixed in the protocol. A use function in the sense of DeMets and Lan was set up by reoptimization, resulting in the type I error level of 0.0125 after observation of 67 progressions. According to Schoenfeld and Richter and compensating for a lost to follow-up rate of 10%, recruitment of 162 patients was planned.
For survival time, a fixed-sample test based on 121 observed deaths was defined in the protocol. Controlling the family-wise error rate at the level of 5%, this test was planned as a confirmatory test in the event of a significant result for the primary end point, with the option of a redesign according to Mu¨ller and Scha¨fer.
Conclusion:
- In clinical trials with interim analysis where the final analysis is performed at a significance level less than 0.05, the correct way for presenting the confidence interval should be using the corresponding percentage.
- In practice, the correct, but odd way was not usually followed. Instead, no matter what the significance level is for the final analysis, the confidence interval is always presented as 95% confidence interval.
- It seems to be acceptable or has been accepted in publications to present a confidence interval that does not match the corresponding significance level or alpha level. If the overall significance level is 0.05, the 95% confidence interval can always be presented no matter what the alpha level or significance level is left for the final analysis due to the adjustment for multiplicity for performing interim analyses.
1 comment:
What are your thoughts on creating 90% CI for comparison between-treatment differences in safety lab parameters (like AST)?
Recently, I learned that a pharma would like to do that in their study (Phase 1 safety and tolerability study), however, I wonder how much value that can add, especially for log-normal parameters like WBC values?
Post a Comment