Monday, May 29, 2023

Final FDA Guidance "Adjusting for Covariates in Randomized Clinical Trials for Drugs and Biological Products" - what we learned?

In May 2023, FDA published the final guidance for industry "Adjusting for Covariates in Randomized Clinical Trials for Drugs and Biological Products". This final version was based on the draft guidance with the same title that was released 4 years ago in April 2019 (see a previous post "FDA and EMA Guidance on Adjusting for Covariates in Randomized Clinical Trials".

FDA created guidance snapshot below:


The final guidance provided the general guidelines on several issues related to the covariates or baseline covariates. 


Both unadjusted analysis and analysis adjusted for baseline covariates are acceptable. However, if analysis is adjusted for baseline covariates, the details about the covariates need to be pre-specified in the statistical analysis plan before the study unblinding. Our experience is that the details about which baseline covariates to be included and whether the baseline covariates are continuous or categorized need to be pre-specified. 

Usually, the analysis adjusted for baseline covariates leads to efficiency gain and is more powerful than the unadjusted analysis. 

It is acceptable to calculate the sample size based on adjusted analysis, but perform the final analysis based on analysis adjusted for baseline covariates. In practice, the sample size calculation is commonly based on adjusted analysis regardless of the final analysis. For example, for a study to compare two group means, the sample size may be calculated based on t-test approach, but the analysis may be based on analysis of covariates where the adjustment for baseline covariates are used. 

For studies with stratified randomization where the randomization is stratified by one or more baseline covariates (categorical), the stratification factors are usually included in the analysis model even though the treatment assignments are generally balanced within each stratum. 

For studies with stratified randomization, it is not uncommon that incorrect stratification may occur where the treatment assignment is picked from the incorrect stratum. When this occurs, there will be two sets of the randomization stratification information (two different strata variables): strata as randomized versus actual strata. It is acceptable to use either strata variable as randomized (intention-to-treat principle) or actual strata variable (correct strata information for all patients). When mis-stratification occurs, there should be any attempt to go back to the randomization systems (such as IRT, IVR, IWR) to correct the stratification allocation. Once randomized, it is randomized. While the incorrect stratification is used for randomization, the correct stratification can be recorded on the case report form or EDC (electronic data capture). See a previous post "Handling Randomization Errors in Clinical Trials with Stratified Randomization".

For studies with continuous outcome measures, the endpoint is usually the change from baseline to a specific visit. Baseline covariate is used in the change from baseline calculation. In the analysis adjusted for baseline covariate, the baseline covariate can still be included in the model even though it gives an impression that the baseline measure is used twice. 

The guidance contains additional guidelines on linear models and non-linear models. For example, for linear models, the issue related to treatment group by covariate interactions is discussed: 


For non-linear models, binary outcome (logistic regression), ordinal outcome (generalized linear model), count outcome (Poisson regression), or time-to-event outcome (Cox regression) are analyzed. The estimators like odds ratio and hazard ratio are called are non-collapsible effect measures. Non-collapsibility implies that the effect parameter is not the same for different sets of covariates that are conditioned on, even if these covariates are independent of the exposure. Even when all subgroup treatment effects are identical, this subgroup specific conditional treatment effect can differ from the unconditional treatment effect. 


Sunday, May 21, 2023

Comparing assumptions for sample size estimation with the interim and final results

Sample size estimation is one of the critical aspects of the clinical trial design. The sample size estimation is usually based on the primary efficacy endpoint. If the primary efficacy endpoint measure is a continuous variable, the sample size estimation will need to be based on assumptions about the effect size (for example, the difference in means) and the common standard deviation If the primary efficacy endpoint measure is a rate and proportion, the sample size estimation will need to be based on the effect size (for example, the difference in responder rate) and the rate/proportion in the control group. 

Sometimes, the sample size estimations can be grossly inaccurate primarily because the assumptions used for the sample size calculation deviate from the observed data. This is especially true in planning pivotal studies with no or insufficient early-phase clinical trial data. 

It is important to check the assumptions for sample size estimation during the study and adjust the sample size when the observed data suggests the inaccuracy of these assumptions. The process is essentially the "Adaptations to the Sample Size" described in FDA's guidance "Adaptive Designs for Clinical Trials"

"Accumulating outcome data can provide a useful basis for trial adaptations. The analysis of outcome data without using treatment assignment is sometimes called pooled analysis. The most widely used category of adaptive design based on pooled outcome data involves sample size adaptations (sometimes called blinded sample size re-estimation). Sample size calculations in clinical trials depend on several factors: the desired significance level, the desired power, the assumed or targeted difference in outcome due to treatment assignment, and additional nuisance parameters—values that are not of primary interest but may affect the statistical comparisons. In trials with binary outcomes such as a response or an undesirable event, the probability of response or event in the control group is commonly considered a nuisance parameter. In trials with continuous outcomes such as symptom scores, the variance of the scores is a nuisance parameter. By using accumulating information about nuisance parameters, sample sizes can be adjusted according to prespecified algorithms to ensure the desired power is maintained. In some cases, these techniques involve statistical modeling to estimate the value of the nuisance parameter, because the parameter itself depends on knowledge of treatment assignment. These adaptations generally do not inflate the Type I error probability. However, there is the potential for limited Type I error probability inflation in trials incorporating hypothesis tests of non-inferiority or equivalence. Sponsors should evaluate the extent of inflation in these scenarios." 

 "One adaptive approach is to prospectively plan modifications to the sample size based on interim estimates of nuisance parameters from analyses that utilize treatment assignment information. For example, there are techniques that estimate the variance of a continuous outcome incorporating estimates of the variances on the individual treatment arms, or that estimate the probability of a binary outcome on the control arm based on only data from that arm. These approaches generally have no effect, or a limited effect, on the Type I error probability. However, unlike adaptations based on non-comparative pooled interim estimates of nuisance parameters, these adaptations involve treatment assignment information and, therefore, require additional steps to maintain trial integrity.
Another adaptive approach is to prospectively plan modifications to the sample size based on comparative interim results (i.e., interim estimates of the treatment effect). This is often called unblinded sample size adaptation or unblinded sample size re-estimation. Sample size determination depends on many factors, such as the event rate in the control arm or the variability of the primary outcome, the Type I error probability, the hypothesized treatment effect size, and the desired power to detect this effect size. In section IV., we described potential adaptations based on non-comparative interim results to address uncertainty at the design stage in the variability of the outcome or the event rate on the control arm. In contrast, designs with sample size adaptations based on comparative interim results might be used when there is considerable uncertainty about the true treatment effect size. Similar to a group sequential trial, a design with sample size adaptations based on comparative interim results can provide adequate power under a range of plausible effect sizes, and therefore, can help ensure that a trial maintains adequate power if the true magnitude of treatment effect is less than what was hypothesized, but still clinically meaningful. Furthermore, the addition of prespecified rules for modifying the sample size can provide efficiency advantages with respect to certain operating characteristics in some settings."

One thing that is often neglected is to compare the final results with the assumptions. When a clinical trial is concluded, it is always good to check how different the final results are from the assumptions. If the final results are positive (indicating the success of the trials), people tend to ignore the assumptions made during the trial planning stage. Only if the final results are negative (indicating the failure of the trials), do people tend to go back to the assumptions and claim that the trial failed due to inaccurate assumptions leading to the lack of statistical power. 

Biogen's Tofersen for SOD1-ALS

Biogen designed a Valor study as the pivotal study to investigate the effect of tofersen for the treatment of patients with Amyotrophic Lateral Sclerosis (ALS) associated with mutations in the superoxide dismutase 1 (SOD1) gene (SOD1-ALS) - a subset of general ALS population. The primary efficacy endpoint is  the ALSFRS-R score and the sample size for the study was based on assumptions about the ALSFRS-R score. 

"We calculated that a sample size of 60 participants (2:1 randomization ratio) in the faster-progression primary analysis subgroup would provide 84% power to detect a between-group difference on the basis of the joint rank test (described below), assuming a change in the ALSFRS-R score from baseline to week 28 of −4.8 in the tofersen group and −24.7 in the placebo group, with a standard deviation of 20.39 and survival of 90% in the tofersen group and 82% in the placebo group, at a two-sided alpha level of 0.05."

The final results indicated that assumptions were so inaccurate. In the placebo group, the change from baseline to week 28 is -8.14 (versus assumed -24.7).

Usually, it is the sponsor's responsibility to ensure that the assumptions for sample size calculation are as accurate as possible. If inaccurate assumptions are used in sample size calculation that leads to the failure of the trial, the regulatory agency may request the sponsor to do additional trials (with more accurate assumptions). However, in Biogen's Tofersen Vilor trial, FDA came to the defense of Biogen why the trial failed in the primary efficacy endpoint in ALSFRS-R score so that they could potentially approve a drug based on the positive results in biomarker and discredit the fact that the study failed in clinical endpoint. In FDA's briefing book for the advisory committee to discuss the Tofersen in SOD1-ALS, the following was mentioned:

Comparing the assumptions for sample size estimation with the analysis results can be complicated by the fact that different statistical methods are used. Sample size estimation may be based on a two-sample t-test while the actual data will be analyzed using more complicated methods (analysis of covariance, mixed model repeated measures, random coefficient model, non-parametric methods,...). For studies with a time-to-event primary efficacy endpoint, the sample size calculation may be based on the log-rank test, and the statistical analyses may be based on the Cox regression where analyses are adjusted for multiple explanatory variables. 

However, it is always good to compare the assumptions for the sample size estimation with the observed data (during the study or at the conclusion of the study). 

Wednesday, May 17, 2023

Another successful trial with randomized withdrawal design

Biotech company PTC Therapeutics announced today that their phase III study of Sepiapterin in PKU patients achieved the primary efficacy endpoint.

PTC Therapeutics Announces APHENITY Trial Achieved Primary Endpoint 

with Sepiapterin in PKU Patients

PKU (Phenylketonuria) is a rare, inherited metabolic disease, which affects the brain. It is caused by a defect in the gene that helps create the enzyme needed to break down phenylalanine. If left untreated or poorly managed, phenylalanine – an essential amino acid found in all proteins and most foods – can build up to harmful levels in the body. This causes severe and irreversible disabilities, such as permanent intellectual disability, seizures, delayed development, memory loss, and behavioral and emotional problems. There are an estimated 58,000 people with phenylketonuria globally.

The pivotal license trial is called APHENITY trial and the randomized withdrawal design was used for the trial even though the randomized withdrawal design was not explicitly mentioned. According to PTC's new release, the APHENITY study is described as the following:
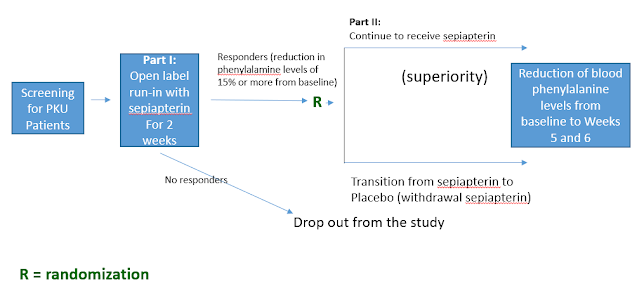
APHENITY was a global double-blind, placebo-controlled, registration-directed study which enrolled 156 children and adults with PKU. Participants were randomized to receive sepiapterin or placebo for six weeks with the primary endpoint being reduction in blood phenylalanine levels. The trial consisted of two parts. Part 1 was a run-in phase, during which all screened subjects received sepiapterin for two weeks. Only those subjects who demonstrated a reduction in phenylalanine levels of 15% or more from baseline in Part 1 were randomized to receive either sepiapterin or placebo in Part 2 of the clinical trial. The primary analysis population consists of those who had greater than 30% reduction in phenylalanine levels from baseline during Part 1 of the trial. The primary outcome measure is the reduction of blood phenylalanine levels from baseline compared to Weeks 5 and 6 in patients from Part 2 of the clinical trial. All patients are eligible to enroll in an open label long term clinical trial designed to further evaluate the long-term safety and durable effect of sepiapterin.

The study design (randomized withdrawal design) can be depicted in the following diagram: 


Through the APHENITY trial, it is demonstrated that the randomized withdrawal design can be successfully used in the pivotal study of the rare, inherited metabolic disease.

Refer to the previous posts on randomized withdrawal design:

Monday, May 01, 2023

Violin plot versus Box-Whisker Plot

A box and whisker plot (Also called: box plot, box-whisker diagram) is defined as a graphical method of displaying variation in a set of data. In most cases, a histogram provides a sufficient display, but a box and whisker plot can provide additional detail while allowing multiple sets of data to be displayed in the same graph. The box-whisker plot displays the following in the data set. 

  1. Minimum value: The smallest value in the data set
  2. Second quartile: The value below which the lower 25% of the data are contained
  3. Median value: The middle number in a range of numbers
  4. Third quartile: The value above which the upper 25% of the data are contained
  5. Maximum value: The largest value in the data set

The box-whisker plot can also indicate the mean value (the dot). The difference between the mean value and the median value can indicate how skewed the data is. 


The box and whisker plot can also include the outliers where outliers are defined as values below Q1 - 1.5 * IQR or values above Q3 + 1.5 IQR (Q1 is 25th percentile and Q3 is 75th percentile, IQR - Interquartile is the distance between 25th percentile and 75th percentile). 


Boxplot can include the only box with lower, upper quartile and median, but not include the min and max values. In a paper by White et al "Combination Therapy with Oral Treprostinil for Pulmonary Arterial Hypertension A Double-Blind Placebo-controlled Clinical Trial", the boxplots without min and max were used to present the NT-proBNP data (a measure with skewed distribution). 

Recently, I see several papers using violin plots to display the data distribution. According to Wikipedia:

violin plot is a statistical graphic for comparing probability distribution. It is similar to a box plot, with the addition of a rotated kernel density plot on each side.

Violin plots are similar to box plots, except that they also show the probability density of the data at different values, usually smoothed by a kernel density estimator. Typically a violin plot will include all the data that is in a box plot: a marker for the median of the data; a box or marker indicating the interquartile range; and possibly all sample points, if the number of samples is not too high.

A violin plot is more informative than a plain box plot. While a box plot only shows summary statistics such as mean/median and interquartile ranges, the violin plot shows the full distribution of the data. The difference is particularly useful when the data distribution is multimodal (more than one peak). In this case a violin plot shows the presence of different peaks, their position and relative amplitude.

Like box plots, violin plots are used to represent comparison of a variable distribution (or sample distribution) across different "categories" (for example, temperature distribution compared between day and night, or distribution of car prices compared across different car makers).

A violin plot can have multiple layers. For instance, the outer shape represents all possible results. The next layer inside might represent the values that occur 95% of the time. The next layer (if it exists) inside might represent the values that occur 50% of the time.

Although more informative than box plots, they are less popular. Because of their unpopularity, they may be harder to understand for readers not familiar with them. In this case, a more accessible alternative is to plot a series of stacked histograms or kernel density distributions.


In a paper by Colli et al "Burden of Nonsynonymous Mutations amongTCGA Cancers and Candidate Immune CheckpointInhibitor Responses", the violin plot was used to display the distribution for r the number of NsM (log10) across different tumor types. 


SAS has a procedure Proc BOXPLOT to generate the box-whisker plots and SAS codes are also provided for generating the Violin plots. Other data analysis software including R have packages to generate the box-whisker plot and violin plot.  

Monday, April 17, 2023

Change from Baseline versus Percent Change from Baseline

The US Food and Drug Administration (FDA) has published its fourth and final guidance in a series of patient-focused drug development (PFDD) guidances meant to help sponsors collect and incorporate patient experience information that can factor into regulatory decision-making. The latest guidance "Patient-Focused Drug Development: Incorporating Clinical Outcome Assessments Into Endpoints For Regulatory Decision-Making" focuses on how clinical outcomes assessments (COA) can be used as endpoints to support a product. It is interesting to see that there is an entire section to discuss the difference between using change from baseline versus percent (or percentage) change from baseline as the endpoint. While the discussion is specifically for COA (clinical outcomes assessments) endpoints, the same discussion points are applicable to other endpoints where the outcome measures are continuous variables. 


Clinical trials are usually designed as longitudinal studies where the baseline measures are performed before the randomization or the first dose of the study drug and then there will be periodic measures (or repeated measures) for the post-baseline visits. 

The statistical analyses may be performed on the original measures, but are more often performed using change from baseline values. For each post-baseline visit, the change from baseline values will be calculated and statistical analyses will include the change from baseline values as the dependent variable and the baseline values will be used as a covariate in the model. Both FDA and EMA have guidelines related to the adjustment for baseline values. 

"Clinical trials often record a baseline measurement of a defined characteristic and record a later measurement of the characteristic to be used as an outcome. When using this approach, adjusting for the baseline value rather than (or in addition to) defining the primary endpoint as a change from baseline is generally acceptable."
"5.6. Change from baseline’ analyses
When the primary analysis is based on a continuous outcome there is commonly the choice of whether to use the raw outcome variable or the change from baseline as the primary endpoint. Whichever of these endpoints is chosen, the baseline value should be included as a covariate in the primary analysis. The use of change from baseline with adjustment for baseline is generally more precise than change of baseline without adjustment. Note that when the baseline is included as a covariate in a standard linear model, the estimated treatment effects are identical for both ‘change from baseline’ (on an additive scale) and the ‘raw outcome’ analysis. Consequently if the appropriate adjustment is done, then the choice of endpoint becomes solely an issue of interpretability."

Percent change from baseline may also be used as the endpoint even though it is less commonly used in the analysis of clinical trial data. FDA's COA guidance clearly indicated the potential issues for using percent change from baseline in the analysis. 

For statistical modeling, Percent change from baseline has some undesirable properties: 
  • It is asymmetric, e.g. a change from 4 to 5 is 25%, but a change from 5 to 4 is -20%. While this is asymmetric, the percent change has been commonly used in measuring the fluctuation of stock prices, a change from $50 to $100 is a 100% increase, but a change from $100 to $50 is a 50% decrease. 
  • The variance is not easily defined. If we rewrite the percent change from baseline, it will be 1−Post-baseline measures/Baseline measure, so the variance is only defined by the ratio of the Post baseline values/baseline value. In statistical modeling, people don't like to deal with the ratio unless there is no better way. When we handle log-normal data (such as pharmacokinetic data), the geometric mean ratio is commonly used. 
  • It is undefined if the baseline is zero
In a paper by Vickers "The use of percentage change from baseline as an outcome in a controlled trial is statistically inefficient: a simulation study", the following conclusions were made:
"Percentage change from baseline has the lowest statistical power and was highly sensitive to changes in variance. Theoretical considerations suggest that percentage change from baseline will also fail to protect from bias in the case of baseline imbalance and will lead to an excess of trials with non-normally distributed outcome data."
Nevertheless, the percent change from the baseline may still be used as the primary efficacy endpoint in some clinical trials. Recently, therapeutic trials for weight loss in non-diabetic patients are hot topics. In clinical trials for weight loss, the primary efficacy endpoint is the Percent Change from Baseline to Week x in weight or BMI (body mass index). 

In a paper by Weghuber, et al "Once-Weekly Semaglutide in Adolescents with Obesity", the primary efficacy endpoint was percent change from baseline to week 68 in BMI. 
Efficacy end points were assessed from baseline (the time of randomization [week 0]) to week 68, unless otherwise stated. The primary end point was the percentage change in BMI, and the secondary confirmatory end point was a reduction in body weight of
at least 5%.

In a paper by Rubino et al "Effect of Weekly Subcutaneous Semaglutide vs Daily Liraglutide on BodyWeight in Adults With Overweight or Obesity Without Diabetes The STEP 8 Randomized Clinical Trial", the primary efficacy endpoint was percentage change from baseline in body weight at week 68. Percent change from baseline was analyzed using analysis of covariance, with randomized treatment as a factor and baseline value of the outcome measure of interest (eg, baseline body weight in kilograms for analysis of percentage change in body weight) as a covariate. Multiple imputation approach was used to handle the missing values. 

In SURMOUNT-1 study by Eli Lilly (Jastreboff, et al "Tirzepatide Once Weekly for the Treatment of Obesity"), co-primary efficacy endpoints were specified: 
Percent change in body weight from baseline to Week 72
AND
Percentage of participants with ≥5% body weight reduction at Week 72

Tuesday, April 11, 2023

Obtaining standard deviations from standard errors and confidence intervals for group means

Sometimes, we need to obtain a standard deviation (SD) in order to calculate the sample size for a new clinical trial where the primary efficacy endpoint is continuous measure. However, when we look at the literature, the SD may not be presented. Instead, the standard error (SE) or confidence intervals (CIs) are presented. The SD can be obtained from the SE or CIs. 

Below are texts from Cochrane Handbooks:

A standard deviation can be obtained from the standard error of a mean by multiplying by the square root of the sample size:

When making this transformation, standard errors must be of means calculated from within an intervention group and not standard errors of the difference in means computed between intervention groups.


Confidence intervals for means can also be used to calculate standard deviations. Again, the following applies to confidence intervals for mean values calculated within an intervention group and not for estimates of differences between interventions (for these, see Section 7.7.3.3). Most confidence intervals are 95% confidence intervals. If the sample size is large (say bigger than 100 in each group), the 95% confidence interval is 3.92 standard errors wide (3.92 = 2 × 1.96). The standard deviation for each group is obtained by dividing the length of the confidence interval by 3.92, and then multiplying by the square root of the sample size:

For 90% confidence intervals 3.92 should be replaced by 3.29, and for 99% confidence intervals it should be replaced by 5.15.


If the sample size is small (say less than 60 in each group) then confidence intervals should have been calculated using a value from a t distribution. The numbers 3.92, 3.29 and 5.15 need to be replaced with slightly larger numbers specific to the t distribution, which can be obtained from tables of the t distribution with degrees of freedom equal to the group sample size minus 1. Relevant details of the t distribution are available as appendices of many statistical textbooks, or using standard computer spreadsheet packages. For example the t value for a 95% confidence interval from a sample size of 25 can be obtained by typing =tinv(1-0.95,25-1) in a cell in a Microsoft Excel spreadsheet (the result is 2.0639). The divisor, 3.92, in the formula above would be replaced by 2 × 2.0639 = 4.128.


For moderate sample sizes (say between 60 and 100 in each group), either a t distribution or a standard normal distribution may have been used. Review authors should look for evidence of which one, and might use a t distribution if in doubt.


As an example, consider data presented as follows:

Group  

Sample size

Mean

95% CI

Experimental intervention

25

32.1

 (30.0, 34.2)

Control intervention

 22

28.3

(26.5, 30.1)

The confidence intervals should have been based on t distributions with 24 and 21 degrees of freedom respectively. The divisor for the experimental intervention group is 4.128, from above. The standard deviation for this group is √25 × (34.2 – 30.0)/4.128 = 5.09. Calculations for the control group are performed in a similar way.


It is important to check that the confidence interval is symmetrical about the mean (the distance between the lower limit and the mean is the same as the distance between the mean and the upper limit). If this is not the case, the confidence interval may have been calculated on transformed values (see Section 7.7.3.4).

In the literature, the SEs and CIs are usually calculated from more sophisticated models (analysis of covariance, mixed model,...) - analyses adjusted for additional covariates. The methods described above can still be used to obtain the SDs - the calculated SDs should still be provide a good approximation of the SDs that are needed for planning future trials. 


in a paper by Jastreboff et al (2022) "Tirzepatide Once Weekly for the Treatment of Obesity", the sample size calculation was based on group mean difference and common standard deviation. 

"We calculated that a sample size of 2400 participants would provide an effective power of greater than 90% to demonstrate the superiority of tirzepatide (10 mg, 15 mg, or both) to placebo, relative to the coprimary end points, each at a two-sided significance level of 0.025. The sample-size calculation assumed at least an 11-percentage-point difference in the mean percentage weight reduction from baseline at 72 weeks for tirzepatide (10 mg, 15 mg, or both) as compared with placebo, a common standard deviation of 10%, and a dropout rate of 25%."
However, the study results were presented with LS mean difference in percentage change in body weight between two groups and their 95% confidence intervals. Standard deviations were not provided, but can be easily calculated using the method described above. 

Using Tirzepatide 15 mg group as an example, SD for 'percent change in body weight' can be calculated as SD1 =sqrt(630) * (-19.9 - (-21.8))/3.92 = 12.2; SD for 'Difference from placebo in percentage change in body weight' can be calculated as sqrt(630) x (-16.3 - (-19.3))/3.92 =19.2. The actual SDs from the study data are a little bit higher than the assumed SD of 10%.
 

Saturday, April 01, 2023

"Ensuring Public Trust in an Empowered FDA" - Accelerated Approval

 In the latest issue of New England Journal of Medicine, Drs Ross, Berg, and Ramachandran wrote a paper:

"Ensuring Public Trust in an Empowered FDA". 

The paper discussed the recent trend that FDA is granting drug approval using the accelerated approval pathway - approval based on the biomarker or surrogate end points that are deemed “reasonably likely” to predict clinical benefit. 

The accelerated approval pathway was one of the expedited pathways for drug approval in FDA's guidance "Expedited Programs for Serious Conditions – Drugs and Biologics". The guidance defined the accelerated approval as the following: 


Accelerated approval has been historically used in HIV drug approval and oncology drug approval (mostly successful), however, in recent years, the FDA has increasingly expanded the use of the accelerated approval program beyond HIV and oncology therapies - mainly in the neurology area such as DMD, Alzheimer's disease, and ALS. 

The FDA argued that the FDA should exercise “the greatest flexibility possible” under its statutory authority in considering accelerated approval for drugs for the treatment of serious conditions with unmet medical needs. However, applying "the greatest flexibility possible" can empower the FDA, but it may come with consequences. 

Accelerated approval is based on a surrogate endpoint that is reasonably likely to predict clinical benefits, however, the "reasonably likely to predict clinical benefits" can be difficult to prove, and a lot of time is claimed based on conflicting evidence. According to the paper by Drs Fleming and Powers "Biomarkers and Surrogate Endpoints In Clinical Trials", it is extremely difficult to verify a biomarker can be a surrogate endpoint and can reasonably likely predict clinical benefits. 

The authors concluded:

 "An empowered FDA may prioritize using its regulatory authority to enable timely access to innovative products, but to ensure continued trust in the agency, this priority should be balanced against the challenges clinicians, patients, and caregivers face when there is substantial residual uncertainty about product safety and efficacy."
Also noted was that the FDA established a website "Accelerated Approval Program" where drugs approved through accelerated approval pathway were listed and the status of confirmatory trials to prove the clinical benefit was also listed. 'Ongoing' indicates that the confirmatory trial is ongoing; 'verified clinical benefit indicates the clinical benefit has been confirmed; and 'withdrawn' indicates that the clinical benefit has not been confirmed in the confirmatory trials and the drug approved through accelerated approval has been withdrawn. 

Accelerated Approval is a hot topic lately: 
"Accelerated approval expedites the marketing of medications based on uncertain efficacy evidence, but the process depends on timely follow-up trials.We found that more than half of so-called confirmatory studies were not completed in the agreed-on time. In contrast with a recent Office of the Inspector General Report of incomplete confirmatory trials, our study includes late completed trials and manufacturer-reported delays. Limitations include shorter follow-up for more recent accelerated approvals and inability to identify reasons for trial delays.

Incomplete confirmatory clinical trials harm patients who are prescribed expensive drugs
despite uncertain clinical benefits. However, drug manufacturers face few consequences for delays. The Consolidated Appropriations Act for 20236 included accelerated approval reforms, such as granting the FDA greater authority to ensure confirmatory trials are under way before approval, mandating progress reports every 6 months by manufacturers, and clarifying procedures for withdrawal if follow-up trials do not find clinical benefit. It will be important to monitor whether these changes lead to fewer delays or whether additional authority is needed to assure that confirmatory trials are completed in a timely manner for the benefit of patients."

Saturday, March 11, 2023

Critical Dates after NDA/BLA submission: Filing Date (Day 1), Day 14, Day 60, Day 74, and PDUFA date

After the NDA/BLA is submitted to FDA, the FDA review clock starts. There are several critical dates relevant to the applicant (the sponsor).

Filing date (Day 1): the date that the NDA/BLA application is received by FDA. Nowadays, the NDA/BLA submission will be in eCTD format and go through FDA's electronic submission gateway. FDA will receive the NDA/BLA submission on the same day (or the next day) as the sponsor submits. The review clock (or PDUFA time clock) begins when the application is received by the FDA. 

Day 14: FDA acknowledges to the sponsor in writing (filing letter) that the application is received. Between Day 1 - Day 14, the FDA could request the sponsor to correct the conformance issues. For example, the data sets in the SAS transport file were created using incorrect procedures and could not be opened by the FDA. FDA would ask the sponsor to resubmit the data sets in the SAS transport file using the correct procedures. 

Filing Letter – a letter issued to notify the applicant that their submission has been filed and will be reviewed. Note: The filing letter also includes information stipulated by PDUFA and may contain any identified filing deficiencies.

According to OFFICE OF MANAGEMENT: Effect of Failure to Pay BsUFA Fees

If the applicant (including its affiliates) is not in arrears and has satisfied any fee requirements for the application, then the RPM /RBPM aligned with the review division sends an Acknowledgement Letter within 14 calendar days of receipt of submission to the applicant.

Day 60: The sponsor will be notified within 60 days of submitting the NDA/BLA whether the application has been accepted for filing (or conversely, if the FDA refuses to file the application due to lack of information or studies).

According to CDER 21st Century Review Process Desk Reference Guide, by Day 60, FDA needs to: 

  • Inform the applicant of a Priority Designation in Writing Communicate Filing Determination to Applicant (for BLAs and priority NDAs) 
  • Notify Applicant of a Refuse-to-File determination. Communicate an RTF action to the applicant by day 60 in the form of official correspondence. Refusal to file (RTF) is the Food and Drug Administration (FDA)’s formal decision to deny review of a New Drug Application (NDA), Biologics License Application (BLA), supplemental NDA (sNDA) and supplemental BLA (sBLA) due to application deficiencies. 
If the sponsor requested for priority review and did not receive a notification by Day 60, it is most likely that the priority review was not granted by the FDA. The standard review (10-months) will follow. 

Day 74 (Deficiencies Identified) Letter – a letter notifying the applicant of issues identified during the filing review phase that were not communicated in the filing letter. It is likely that the issues related to the statistical analyses will be included in the Day-74 letter. 

According to PDUFA REAUTHORIZATION PERFORMANCE GOALS AND PROCEDURES FISCAL YEARS 2018THROUGH 2022:

Day 74 Letter: FDA will follow existing procedures regarding identification and communication of filing review issues in the “Day 74 letter.” For applications subject to the Program, the timeline for this communication will be within 74 calendar days from the date of FDA receipt of the original submission. The planned review timeline included in the Day 74 letter for applications in the Program will include the planned date for the internal mid-cycle review meeting. The letter will also include preliminary plans on whether to hold an Advisory Committee (AC) meeting to discuss the application. If applicable, the Day 74 letter will serve as notification to the applicant that the review division intends to conduct an expedited review.

Review performance goals: For NME NDA and original BLA submissions that are filed by FDA under the Program, the PDUFA review clock will begin at the conclusion of the 60 calendar day filing review period that begins on the date of FDA receipt of the original submission. 

Day 74 Letter: If the application is accepted for filing (60 days after submission), then the sponsor will receive an FDA 74-day letter, which contains a planned NDA review timeline that varies based on several factors such as whether other similar drugs already exist or whether your drug treats an unmet medical need.

The FDA 74-Day letter also confirms your action date (PDUFA date), confirms standard versus priority review, and identifies any preliminary deficiencies in your application. Sponsors must act quickly to resolve the deficiencies noted in the FDA 74-day letter during the NDA review process.

According to CDER 21st Century Review Process Desk Reference Guide, by Day 74 (i.e., Day 60 + 14 Days), FDA needs to:

  •  Communicate Filing Review Issues
  •  Communicate “Program” Review Timeline to Applicant (if applicable)

According to MAPP: OFFICE OF NEW DRUGS  Review Designation Policy: Priority (P) and Standard (S), the sponsor will be informed of the priority review designation by Day 60. If the sponsor is not notified of the priority review designation by Day 60, it means that the request for priority review is not granted, and the standard review designation will be applicable. 

The division will inform the applicant in writing of a priority review designation by Day 60 of the review. The division will inform the applicant of a standard review designation in the filing communication by Day 74 of the review.

PDUFA date (FDA action date): 

Prescription Drug User Fee Act (PDUFA) dates refer to deadlines for the FDA to review new drugs. The PDUFA date is 10 months after the drug application has been accepted by the FDA or 6 months, if the drug is given a priority review designation.

By the PDUFA date, FDA needs to notify the sponsor if its NDA/BLA application is approved, tentative approved (pending the patent issues or exclusivity issues), or given a complete response letter (CRL). FDA issues a CRL when declining the NDA/BLA. The CRL will include the reasons why the FDA can not approve the NDA/BLA in its current format. 

Notice that the PDUFA date (6 months for priority review and 10 months for standard review) may not be calculated from the filing date (day 1), but rather is calculated from Day 60 after the filing date - this essentially adds two months to the review timeline. Two months are necessary for FDA to conduct the initial review to decide if the application is reviewable. With these two months (60 days), the PDUFA date may actually be 8 months for some applications with priority review designation and 12 months for standard review after the sponsor submits the NDA/BLA. 

The initial scheduled PDUFA date will be extended if additional data or materials are submitted during the review period, which constitutes a major amendment to the NDA/BLA submission. 

This Youtube video explained very well about NDA and BLA Application Review Process as part of the REdI Annual Conference (2019)

I have collected some recent NDA/BLA (or supplemental NDA/BLA) submissions to see when FDA notification date is relevant to the submission date and how the PDUFA date is determined. 


Submission date/filing date

FDA notification date

PDUFA date

Actual Decision Date

Akebia NDA for Vadadustat for the Treatment of Anemia Due to Chronic Kidney Disease

March 30, 2021

June 1, 2021


By Day 60

March 29, 2022

Standard review – 10 months from Day 60

March 30, 2022


CRL was issued

Amarin sNDA for VASCEPA® for cardiovascular risk reduction

March 28, 2019

May 29, 2019


By day 60


September 28, 2019

Priority Review – 6 months from the filing date

December 13, 2019

Approved,

3 months of delay due to conducting Adcomm

Amylyx NDA for AMX0035 for the Treatment of ALS

November 2, 2021

December 29, 2021


By Day 60

June 29, 2022


Priority review – 6 months from Day 60

September 29, 2022

Approved

3 months of delay due to conducting two rounds of Adcomm

Blueprint Medicines sNDA  for AYVAKIT® for the Treatment of Indolent Systemic Mastocytosis

November 22, 2022

January 23, 2023


By Day 60

May 22, 2023


Priority review – 6 months from the filing date


Acadia Pharmaceuticals NDA for Trofinetide for the Treatment of Rett Syndrome

July 18, 2022


September 12, 2022


Within Day 60

March 12, 2023


Priority review – 6 months from Day 60


Argenx BLA for efgartigimod for treatment of generalized Myasthenia Gravis

September 21, 2022

November 22, 2022


By Day 60


March 20, 2023


Priority review – 6 months from the filing date


Cidara Therapeutics NDA for Rezefungin for treatment of Candidemia and invasive candidiasis

July 27, 2022

September 20, 2022

Within Day 60

March 22, 2023


Priority review – 6 months from Day 60


Ionis with Biogen NDA for tofersen for ALS


July 26, 2022


Jan. 25, 2023

Priority review – 6 months from Day 60


Biomarin BLA Gene Therapy for Hemophilia A

September 29, 2022

Resubmission

October 12, 2022

March 31, 2023

6 months from resubmission date


Gamida cell BLA for Omidubicel for hematologic and solid cancer

June 2, 2022


August 1, 2022


By Day 60 

January 30, 2023

Priority review – 6 months from Day 60

PDUFA date is further extended by 3 months to May 1, 2023

Ascendis Pharma


August 31, 2022

October 31, 2022


By Day 60 

April 30, 2023

Priority review – 6 months from Day 60


Biomarin BLA Gene Therapy for Hemophilia A

December 23, 2019

February 20, 2020

By Day 60

August 21, 2020

Priority review - 6 months from Day 60

August 18, 2020


CRL was issued

Arcutis’ ZORYVE™ (Roflumilast) Cream 0.3% For the Treatment of Plaque Psoriasis

October 4, 2021

December 22, 2021

By Day 74

July 29, 2022

Standard review – almost 10 months from filing date

July 29, 2022


approved

Apellis NDA for Pegcetacoplan for Geographic Atrophy

June 1, 2022

July 19, 2022


Within Day 60

November 26, 2022

Priority review – Less than 6 months from the filing date

February 17, 2023

Approved, Almost three months of delay due to a major amendment to the NDA (additional submission of long-term data)

TG Therapeutics BLA for Umbralisib for treatment of Lymphoma

June 17, 2020

August 13, 2020


With Day 60

February 15, 2021

Priority review – 6 months from Day 60

February 5, 2021

Approved, Then FDA withdrew the approval

Reata Pharmaceutics NDA for omaveloxolone for the Treatment of Friedreich’s Ataxia

March 31, 2022

May 26, 2022


Within Day 60


November 30, 2022

Priority review – 6 months from the filing date

February 28, 2023

Approved, 

5 months of delay due to a major amendment to include the OLE data

Prevention Bio BLA for Teplizumab for Type 1 Diabetes

November 2, 2020

January 4, 2021


By Day 60

July 2, 2021

Priority review – 6 months from Day 60

July 2, 2021

CRL was issued


Liquidia NDA LIQ861 for treatment of PAH

January 27, 2020

April 8, 2020


By Day 74


November 24, 2020

Standard review – 10 months from the filing date

November 25, 2020

CRL was issued

Horizon sBLA for KRYSTEXXA® for Uncontrolled Gout


January 10, 2022


March 7, 2022


Priority review -

July 7, 2022

Priority review – 6 months from the filing date

July 8, 2022


Approved