Thursday, December 26, 2013

Quantification of Risk – Breaking down adverse reaction into common and uncommon categories

When we conduct a clinical trial using an approved product, we may run into the requests for the list of common, very common adverse events. This may be especially true when the clinical trials are conducted in European countries. The requests may come from the IRB (institutional review board) or EC (ethics committee).


Breaking down the AEs into very common, common, uncommon, rare, and very rare categories is part of the requirements for SmPC (product label in EU countries). The requirements are included in various EC or EMA guidelines

Within each system organ class, the ADRs should be ranked under headings of frequency, most frequent reactions first, using the following convention:
 Very common (greater than and equal to 1/10); common (greater than and equal to 1/100 to less than 1/10); uncommon (greater than and equal to 1/1,000 to less than 1/100); rare  (greater than and equal to 1/10,000 to less than 1/1,000); very rare (less than and equal to 1/10,000), not known (cannot be estimated form the available data).

Within each system organ class, the adverse reactions should be ranked under headings of frequency, most frequent reactions first. Within each frequency grouping, adverse reactions should be presented in the order of decreasing seriousness. The names used to describe each of the frequency groupings should follow standard terms established in each official language using the following convention: Very common (≥1/10); common (≥1/100 to <1/10); uncommon (≥1/1,000 to <1/100); rare (≥1/10,000 to <1/1,000); very rare (<1/10,000). 
An EMA presentation specifically discussed what the Section 4.8: Undesirable effects should include in terms of quantifying the adverse drug reactions.

There are plenty of examples for showing how the adverse drug reaction tables in Summary of Product Characteristics should be presented.

In the recent issued EMA guidance for Fibrin Sealant, it also requires to breakdown the AEs into the following categories:

Tabulated list of adverse reactions

The table presented below is according to the MedDRA system organ classification (SOC and Preferred 265 Term Level).  
Frequencies have been evaluated according to the following convention: Very common (greater than and equal to 1/10); common (greater than and equal to 1/100 to less than 1/10); uncommon (greater than and equal to 1/1,000 to less than 1/100); rare (greater than and equal to 1/10,000 to less than 1/1,000); very rare (less than 1/10,000), not known (cannot be estimated from the available data).

The source for the quantification of risk for adverse reactions is the CIOMS. For example, Benefit-Risk Balance for Marketed Drugs: Evaluating Safety Signals Report of CIOMS Working Group IV has a section for “quantification of risk”

5. Quantification of Risk Incidence of the reaction
To put the newly identified risk into perspective, it is important to quantify it in terms of incidence. Precise quantification will usually be difficult in the post-marketing environment, in which most new safety signals arise from spontaneous reporting, with its associated uncertainties as to numerators (reported cases) and denominators (patient exposures). However, risk can often be approximated in terms of magnitudes of 10, as suggested in the CIOMS III report: greater than 1% (common or frequent); greater than 1 per 1000 but less than 1 per cent (uncommon or infrequent); greater than 1 per 10,000 but less than 1 per 1000 (rare); less than 1 per 10,000 (very rare). 
When possible, attempts should be made to determine whether the incidence is affected by the existence of any apparent high-risk groups. These might be defined by, for example, dose or duration of treatment, use of other drugs (e.g., drug interactions), presence of other diseases (e.g., renal failure), or special populations defined by demographics or ethnicity. In principle, one of the most important functions of risk evaluation is to identify individual patients at increased risk of serious adverse reactions. Although some mechanisms are fairly well understood (enzyme inhibition processes; drug interactions), the pharmacological and biological basis of drug-induced diseases (e.g., role of pharmacogenetics) is relatively unexplored. Work in this area is needed and should be encouraged.

In US, when we prepare the summary tables for adverse events or adverse drug reactions, we typically don’t include a table to break down the frequency into very common, common, uncommon, rare and very rare categories. The drug label did not require to include the quantification of risk using these categories. However, for drug to be approved in European countries, it is a good idea to include a summary table with these quantification categories. 

Tuesday, December 10, 2013

Pharmacokinetic studies when endogenous compounds exist and pre-dose concentrations are not zero

This Monday, FDA issued a new guidance titled “ Bioequivalence Studies with Pharmacokinetic Endpoints for Drugs Submitted Under an ANDA”. While the guidance is more for bioequivalence studies for generic drugs, a paragraph on Endogenous Compounds caught my eyes:

E. Endogenous Compounds
 Endogenous compounds are drugs that are already present in the body either because the body produces them or they are present in the normal diet. Because these compounds are identical to the drug that is being administered, determining the amount of drug released from the dosage form and absorbed by each subject can be difficult. We recommend that applicants measure and approximate the baseline endogenous levels in blood (plasma) and subtract these levels from the total concentrations measured from each subject after the drug product has been administered. In this way, you can achieve an estimate of the actual drug availability from the drug product. Depending on whether the endogenous compound is naturally produced by the body or is present in the diet, the recommended approaches for determining BE differ as follows:  When the body produces the compound, we recommend that you measure multiple baseline concentrations in the time period before administration of the study drug and subtract the baseline in an appropriate manner consistent with the pharmacokinetic properties of the drug.
  When there is dietary intake of the compound, we recommend that you strictly
control the intake both before and during the study. Subjects should be housed at a
clinic before the study and served standardized meals containing an amount of the
compound similar to that in the meals to be served on the pharmacokinetic sampling day.
 For both of the approaches above, we recommend that you determine baseline concentrations for each dosing period that are period specific. If a baseline correction results in a negative plasma concentration value, the value should be set equal to 0 before calculating the baseline-corrected AUC. Pharmacokinetic and statistical analysis should be performed on both uncorrected and corrected data. Determination of BE should be based on the baseline-corrected data.

When we study the therapeutic proteins, we often need to deal with the endogenous concentration issue. Studies using human plasma derived products (proteins) will always involve in the endogenous concentration issue since these therapeutic proteins are naturally occurring substances and are already present in the body. The pharmacology studies for these therapeutic proteins need to consider both the endogenous (already in the body) and exogenous (through augmentation) concentrations. In a book “Clinical pharmacology of therapeutic proteins” by Dr Mahmood, three approaches are discussed to deal with this issue:
  1. subtract the pre-dose concentration – baseline-corrected pharmacokinetic analysis
  2. using the sum of exogenous and endogenous proteins following the administration of exogenous protein – uncorrected pharmacokinetic analysis;
  3. the use of radio-labeled proteins to differentiate the exogenous proteins from the endogenous proteins.


For a bioequivalence study, it is easier to show the bioequivalence with approach #2 above.

When using baseline-corrected pharmacokinetic analyses, the accurate measure of the pre-dose concentration is important. If all possible, there should be multiple measures at pre-dose and then mean value of the pre-dose measuresments can be used as the baseline for correction.

In FDA’s Draft Guidance on Progesterone, it has the following comments regarding the baseline-correction.
 Please measure baseline progesterone levels at -1.0, -0.5, and 0 hours before dosing. The mean of the pre-dose progesterone levels should be used for the baseline adjustment of the post-dose levels. Baseline concentrations should be determined for each dosing period, and baseline corrections should be period specific. If a negative plasma concentration value results after baseline correction, this should be set to 0 prior to calculating the baseline-corrected AUC. Please analyze the data using both uncorrected and corrected data.
  
In a clinical pharmacology review document for a Factor XIII Concentrate, the sponsor presented the pharmacokinetic parameters based on baseline adjusted FXIII activity (Berichrom assay) and  also the pharmacokinetic parameters based on un-adjusted FXIII activity.


In summary, while both baseline-adjusted and unadjusted PK analyses are viable approaches in dealing with the existence of endogenous concentrations, the baseline-adjusted PK analyses are the safer approach to go. In this approach, the pre-dose concentration or average pre-dose concentration will be subtracted from all post-dose concentration measures before the PK parameters (for example AUC) are calculated.  

Sunday, December 08, 2013

SAS Programming for PK Time-Concentration Curve Using SGPLOT

Comparing with other software/tools for generating the graphs, SAS/Graph may be inferior. Programming to generate graphs using SAS/Graph languages can be time consuming and the quality of the graphs is usually not so great and not in publication quality. It is also not easy to output the graphs in the commonly used format. With SAS/Graph, we usually create the graph files in .cgm and then use a MS Word macro to load the .cgm files into MS Word file.

Now SAS has offered two new ways to generate the graphs: SASODS Graphics and SAS Stat Graphics. I had previously discussed SAS ODS Graphicswith template using Proc Lifetest to generate the Kaplan-Meier curve.

The procedure SGPLOT in SAS ODS Graphics can be used to generate high quality graph. With SGPLOT available, SAS/Graph procedure GPLOT become obsolete. The programs below illustrate the use of SGPLOT to generate the time-concentration curve for PK concentration data.

The graph generated from the programs is directly outputted in a .pdf file.

data pconc;
  input drug $ time concentration;
datalines;
Test  0   0
Test  1  32
Test  3 100
Test  6 140
Test  12 70
Test  24 25
Test  48  5
Test  72  1
Ref   0   0
Ref   1  40
Ref   3 105
Ref   6 135
Ref  12  80
Ref  24  28
Ref  48   7
Ref  72   0
;

options orientation=landscape nodate;
ods graphics / reset width=9in noborder;
    *width option defines the size of the graph. Noborder option remove  
     the border around the figure;

ods pdf file = "c:\temp\MySGPLOT.pdf"
 pdftoc = 0
 startpage = no
 style = printer
 dpi = 250;   

ods pdf nobookmarkgen;

title1 j=c "FIGURE #.#" ;
title2 j=c "MEAN PLASMA CONCENTRATION VS. TIME CURVES" ;
title3 j=c "BY TREATMENT" ;
title4 j=C "POPULATION:  PK" ;

footnote1 j=l "%upcase(PROGRAM: xxx.sas)                                                                                                                 (&sysdate &systime)";
run ;

proc sgplot data=pconc ;
    series x = time y = concentration
         /group=drug lineattrs = (thickness = 1 pattern=solid) markers;
    xaxis label = 'Time Post Study Drug Administration (hours)' 
         grid values = (0 to 80 by 5);
    yaxis label = 'Mean Concentration' grid values = (0 to 160 by 40); 
    keylegend / location=inside position=topright;
run;


ods pdf close;


References: 


Sunday, November 17, 2013

Causality Assessment, Causality Categories for Reporting Adverse Events or Adverse Reactions

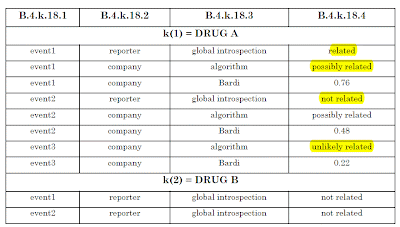
In clinical trials, safety reporting is a critical issue. This includes the reporting of safety information (adverse events or adverse reactions) from the investigational sites to the sponsor and then from sponsor to the regulatory agencies (FDA, EU) and distribution of the safety information to other investigational sites and IRBs. There have been many regulatory guidelines regarding the reporting of the safety information. However, none of the guidelines give clear instruction on how to categorize the causality for adverse events or adverse reactions.

In recent FDA’s guidance “Safety Reporting Requirements for INDs and BA/BE Studies”, it reiterates the concept of “reasonable possibility” for causality assessment, but does not provide the causality categories.

“Suspected adverse reaction means any adverse event for which there is a reasonable possibility that the drug caused the adverse event. For the purposes of IND safety reporting, ‘reasonable possibility’ means there is evidence to suggest a causal relationship between the drug and the adverse event. A suspected adverse reaction implies a lesser degree of certainty about causality than adverse reaction, which means any adverse event caused by a drug. Suspected adverse reactions are the subset of all adverse events for which there is a reasonable possibility that the drug caused the event. Inherent in this definition, and in the requirement to report suspected adverse reactions, is the need for the sponsor to evaluate the available evidence and make a judgment about the likelihood that the drug actually caused the adverse event. We consider the application of the reasonable possibility causality standard to be consistent with the discussion about causality in the International Conference on Harmonization (ICH) E2A Guideline (“ICH E2A guidance”)."


In FDA’s guidanceGood Pharmacovigilance Practices and Pharmacoepidemiologic Assessment”, they cited WHO, the Uppsala Monitoring Center, 2000, Safety Monitoring of Medicinal Product.
 “FDA does not recommend any specific categorization of causality, but the categories probable, possible, or unlikely have been used previously. If a causality assessment is undertaken, FDA suggests that the causal categories be specified and described in sufficient detail to understand the underlying logic in the classification.”
The regulatory guidance leaves the sponsor to decide what to be considered as ‘reasonable possibility’. The sponsor can design the data collection form (SAE form or adverse event case report form) using various categories for causality assessment/reporting.

For data collection purpose, what categories should be collected for causality assessment?

In ICH E2A CLINICAL SAFETY DATA MANAGEMENT: DEFINITIONS AND STANDARDS FOR EXPEDITED REPORTING”, there is a paragraph regarding the causality assessment and causality categories.  

“Many terms and scales are in use to describe the degree of causality (attributability) between a medicinal product and an event, such as certainly, definitely, probably, possibly or likely related or not related. Phrases such as "plausible relationship," "suspected causality," or "causal relationship cannot be ruled out" are also invoked to describe cause and effect. However, there is currently no standard international nomenclature. The expression "reasonable causal relationship" is meant to convey in general that there are facts (evidence) or arguments to suggest a causal relationship. “

Causality assessment by investigator (definitely; probably; possibly; unlikely related)

In ICH E2BMAINTENANCE OF THE ICH GUIDELINE ON CLINICAL SAFETY DATA MANAGEMENT: DATA ELEMENTS FOR TRANSMISSION OF INDIVIDUAL CASE SAFETY REPORTS “, the following causality categories are referenced in the examples provided in the guidelines. It turns out that these categories seem to be the most commonly used in practice.

The CDISC, CDASH considered causality assessment (relationship to study treatment) as a sponsored defined field. However, it recommends the categories listed in ICH E2B example:

“Sponsored-defined terminology will be used to indicate the relationship between the AE and the study treatment (e.g. ICH E2B examples: Not Related, Unlikely Related, Possibly Related, Related). “

EU regulations regarding the safety report are generally consistent with the ICH guidance (specifically ICH EB2) and do not provide any specific guidance on specific causality categories to use.

EMA Guideline on Good Pharmacovigilance Practice (GPV) recommends the following:


Different methods may be applied for assessing the causal role of a medicinal product on the reported adverse event (e.g. WHO-UMC system for standardised case causality assessment). In this situation, the levels of causality, which correspond to a reasonable possibility of causal relationship, should be established in advance in order to determine when an adverse event is considered as an adverse reaction.
Some sponsors used the causality categories from WHO 2000 Safety Monitoring of Medicinal Product that used the following categories. Definitely Probably Possibly Unlikely Conditional Related Related Related Related. For example, A FDA communication with Cangene Corporation indicated the following AE causality categories are used: Definitely related, Probably related, Possibly related, Unlikely related, and Conditional. This is the same as the above-mentioned WHO-UMC system for standardised case causality assessment.

CAUSALITY CATEGORIES
The causality categories described by the Uppsala Monitoring Centre are as follows. However, the following categories may be modified in the practical use. 
1. Certain: a clinical event, including laboratory test abnormality, occurring in a plausible time relationship to drug administration, and which cannot be explained by concurrent disease or other drugs or chemicals. The response to withdrawal of the drug (dechallenge) should be clinically plausible. The event must be definitive pharmacologically or phenomenologically, using a satisfactory rechallenge procedure if necessary.
2. Probable/Likely: a clinical event, including laboratory test abnormality, with a reasonable time sequence to administration of the drug, unlikely to be attributed to concurrent disease or other drugs or chemicals, and which follows a clinically reasonable response on withdrawal (dechallenge). Rechallenge information is not required to fulfil this definition.
3. Possible: a clinical event, including laboratory test abnormality, with a reasonable time sequence to administrations of the drug, but which could also be explained by concurrent disease or other drugs or chemicals. Information on drug withdrawal may be lacking or unclear.
4. Unlikely: a clinical event, including laboratory test abnormality, with a temporal relationship to drug administration which makes a causal relationship improbable, and in which other drugs, chemicals or underlying disease provide plausible explanations.
5. Conditional/Unclassified: a clinical event, including laboratory test abnormality, reported as an adverse reaction, about which more data is essential for a proper assessment, or the additional data is under examination.
6. Unassessable/Unclassifiable: a report suggesting an adverse reaction which cannot be judged because information is insufficient or contradictory, and which cannot be supplemented or verified.
Some sponsors may use the following categories and definitions for AE causality. For example, an NDA review memo from FDA indicated that the sponsor used the following causality categories: probable, possible, unlikely and not assessable. The instructions for the AE causality assessment are explained below:

Relationship to Investigational ProductThe assessment of the relationship of an adverse event to the administration of study drug (none, unlikely (remote), possible, probable, not assessable) is a clinical decision based on all available information at the time of the completion of the case report form.
None – includes: (1) the existence of a clear alternative explanation (e.g. mechanical bleeding at surgical site); or (2) non-plausibility (e.g., the patient is struck by an automobile at least where there is no indication that the drug caused disorientation that may have led to the event; cancer developing a few days after drug administration).
Unlikely (remote) – a clinical event, including lab abnormality, with an improbable time sequence to drug administration and in which other drugs, chemicals or underlying disease provide plausible explanation.
Possible – a clinical event including lab abnormality, with a reasonable time sequence to administration of the drug, which could also be explained by concurrent disease* or other drugs or chemicals.  Information on drug withdrawal may be lacking or unclear.
Probable – a clinical event including lab abnormality, with a reasonable time sequence to administration of the drug, unlikely to be attributed to concurrent disease* or other drugs or chemicals, and which follows a clinically reasonable response on withdrawal (dechallenge).
Not assessable – a report of an AE which cannot be judged because information is insufficient or contradictory, and which cannot be supplemented or verified.
Table below summarized various causality categories:
ICH E2B
Not Related, Unlikely Related, Possibly Related, Related)
CDISC
Not Related, Unlikely Related, Possibly Related, Related).
WHO
Certain, Probable/Likely, Possible, Unlikely, Conditional/Unclassified
Other options
None, Unlikely, Possible, Probable, Not assessable


Due to the fact that there is no clear regulatory guidance on the use of the causality categories, different sponsors could use different causality categories. The consequence is that the so-called drug–related adverse events (or the new term adverse drug reactions) can not be directly compared across the studies by different sponsors. The biases can arise if we attempt to compare the results from different studies conducted by different sponsors where the different causality categories are used. 

Monday, November 11, 2013

Submit the Clinical Trial Datasets to FDA: Using the right .xpt file format

When we submit the clinical trial datasets to FDA, we need to convert the datasets in original format (.sas7bdat) to .xpt format. There are two ways to convert the SAS datasets to .xpt format. However, only the .xpt format generated with Proc Copy can be accepted by FDA.

In FDA’s Study Data Specifications, section 2 (dataset specifications) is very specific about the data format that FDA will accept. It emphasized that "SAS transport file processed by the CPORT SAS PROC cannot be processed or achieved by the FDA"

2.1 File Format

SAS XPORT Transport File format

SAS XPORT transport file format, also called Version 5 SAS transport format, is an open format published by the SAS Institute. The description of this SAS transport file format is in the public domain. Data can be translated to and from this SAS transport format to other commonly used formats without the use of programs from SAS Institute or any specific vendor.
Version

In SAS, SAS XPORT transport files are created by PROC XCOPY in Version 5 of SAS software and by the XPORT SAS PROC in Version 6 and higher of SAS Software. SAS Transport files processed by the CPORT SAS PROC cannot be processed or archived by the FDA.

Sponsors can find the record layout for SAS XPORT transport files through SAS technical support technical document TS-140. This document and additional information about the SAS Transport file layout can be found on the SAS World Wide Web page at http://www.sas.com/fda-esub.

Transformation of Datasets

SAS XPORT transport files can be converted to various other formats using commercially available off the shelf software.
SAS Transport File Extension

All SAS XPORT transport files should use .xpt as the file extension.

Compression of SAS Transport Files

SAS transport files should not be compressed. There should be one dataset per transport file.

On SAS’s FDA Standards for Electronic Submissions, the differences between two different .xpt file formats are explained in Question & Answer format:
Q. There are two SAS transport file formats. Which one is the FDA prepared to use?

A. FDA can accept data in the SAS XPORT Transport Format that is processed by the XPORT engine in Version 6 of SAS software and later, and by PROC XCOPY in Version 5. 
Q. What are the two SAS transport formats?

A. The XPORT Transport Format selected by the FDA, and the CPORT Transport Format. Both XPORT and CPORT are established mechanisms for data exchange that are well tested and well documented. They are not new or at-risk technology. The XPORT Transport Format is supported on all platforms and releases of the SAS System (it is machine and release independent) from Version 5 on. The CPORT Transport Format was invented in Version 6 and is supported from Version 6 on.

Q. Why did FDA choose the XPORT Transport Format over CPORT Transport Format?

A. XPORT is an open format, while CPORT is a proprietary format.

Q. What do you mean, the XPORT format is "open?"

A. Specifications for the XPORT transport format are in the public domain. Data can be translated to and from the XPORT transport format to other commonly used formats without the use of programs from SAS Institute or any specific vendor.

Q. Why does FDA want an open format?

A. By US law, the FDA must remain "vendor neutral." The FDA cannot endorse or require use of any specific vendor's product.

Q. What is the XPORT transport format, generally?

A. It is a text file, with record length = 80 columns. It looks and feels so much like a text file that it is a good idea to avoid using ".txt" as a file name extension so that the operating system won't treat it as a text file.
When submitting the SAS datasets to FDA, we need to be sure that the .xpt files are generated using PROC COPY. After the .xpt files are generated, we should test if the files can be opened using JMP and SAS Viewer. If the .xpt files are generated correctly, they should be automatically opened if we click the file names.
According to SAS document on PROC COPY, it is very easy to use PROC COPY to create .xpt file.
libname source 'SAS-library-on-sending-host';
                     /*indicating where the original SAS data sets (in .sas7bdat format) are*/
libname xptout xport 'filename-on-sending-host'; 
                      /*indicating where the .xpt files to be stored */
proc copy in=source out=xptout memtype=data;
run;

Alternatively, .xpt files can be created using PROC CPORT. However, .xpt files created by PROC CPORT can not be opened with JMP and can not be opened in SAS Viewer. .xpt file created by PROC CPORT must be opened and retrieved by using PROC CIMPORT.

Since FDA will only accept the .xpt files generated using PROC COPY, I see no reason to use PROC CPORT or PROC CIMPORT.

Saturday, November 02, 2013

Placebo Mean Imputation (PMI)

A while ago, I discussed several simple imputation methods in LOCF, BOCF, WOCF, and MVTF. Recently, I noticed another simple imputation method Placebo Mean Imputation (PMI). This simple imputation method of PMI seems to be used Only for the purpose of sensitivity analyses, not for the primary analysis. It is also true that this approach is mainly used in certain therapeutic areas such as analgesic drug (pain medication) and anti-bacterial drug.  


In FDA's Clinical Review document for a chronic pain medication in 2011,  the Placebo mean imputation is described:

 "Placebo mean imputation (PMI): the missing pain measurements for each day after discontinuation were replaced by the mean of all available pain intensity scores for all placebo-treated patients who completed treatment. Therefore if a patient discontinued treatment or recorded their last pain score at Week 8 of the Maintenance Period, the pain intensity score at Week 12 was imputed using the Week 12 mean pain intensity score for all placebo-treated patients who completed treatment. Also a placebo missing pain score at some time-point was imputed by the observed placebo group mean pain intensity at the same time-point"

In FDA's Statistical Review for the same indication, FDA statistician assessed that PMI is not an appropriate approach

"Since the estimated treatment effect is only influenced by the data from patients completing the study, the PMI method is similar to an analysis of completers. Analyzing completers is
problematic since the outcome of patients completing the study may not represent the outcome of patients not completing the study. In the placebo group, patients completing the study are likely to be the less severely afflicted patients; while in the NUCYNTA group, patients completing the study are likely to be the more severely afflicted patients. As a result, the PMI method assigned good scores from the placebo completers to patients dropping out due to adverse events in the treatment group. Based on these reasons, I conclude that the PMI method is not appropriate."

In a briefing document for FDA anti-infective drug advisory committee meeting for a cystic fibrosis drug in 2012, PMI approach was used by FDA statistical reviewer:

“…In this sensitivity analysis, missing values were imputed using the placebo group mean of -0.57% (i.e. the minimum of 0 and the least favorable group mean) as performed in the Reviewer’s primary analysis and other Reviewer analyses.”

The use of these simple imputation approaches is mainly driven by the perception that these approaches provide conservative estimate of the treatment effect (people have shown that this is not always true). This fits into the Intention-to-treat principle to be conservative in estimating the treatment effect in superiority studies. While it is ok to perform the sensitivity analyses using various simple imputation approaches such as LOCF, BOCF, WOCF, and PMI, these imputation methods should not be used as the primary analysis. 


Further Reading: 

Friday, October 25, 2013

Replies to Inquiries to FDA on Good Clinical Practice

Good Clinical Practice (GCP) is the law of conducting the clinical trials. Sometimes, interpreting the law is challenging, the same is true in interpreting the GCP and other regulatory guidelines. FDA has set up an Office of Good Clinical Practice and provided  Good Clinical Practice Contacts for helping interpreting the GCP and answering the GCP related questions.

Recently, I just found that the FDA has an email address for questions and answers regarding GCP questions. The original questions along with FDA's responses are posted on the web. While FDA's responses may not directly address the original questions being asked, Replies to Inquiries to FDA on Good Clinical Practice is still a great resource.


Monday, October 21, 2013

Monitoring the double-blind study: unblinded pharmacist, unblinded monitor, and drug kit

In many clinical trials with biological products, the investigational products usually need to be reconstituted before the use. If the study is a double-blind study, the reconstitution of the investigational products can not be performed by the investigator in order for the investigator to remain blinded to the treatment assignment.

There are two ways to tackle this issue.

1. Using a third party (unblinded pharmacist).

With this option, the unblinded pharmacist at the investigational site will be the only person who knows the treatment assignment. The unblinded pharmacist will obtain the randomization number and treatment assignment information from the randomization envelope (manual process) or from IRT (interactive response technology including IVR or IWR) system. The unblinded pharmacist will then prepare and reconstitute the study drug, and then give to the investigator for administration.

The unblinded pharmacist must not communicate with the investigator about the subject treatment assignment.

The unblinded pharmacist must maintain the records for drug accountability for auditing and inspections.

With this option, the study team will need to include an unblinded CRA (clinical research associate) for the purpose of checking the drug accountability. In other words, there should be separate roles for two type of clinical monitors:
  • Blinded Monitor: A monitor designated to perform site monitoring activities except for pharmacy, drug accountability, and reconciliation of the blinded investigational products.
  • Unblinded Monitor: A monitor designated to perform the site monitoring activities for pharmacy, drug accountability, and reconciliation of the blinded investigational products.

 Some of the references for this approach:

2. Using the blinded drug kit for the investigational product  

With this approach, in addition to the randomization schedule (containing the  randomization number and the treatment assignment), additional list of drug kit numbers (and the linked batch or lot number corresponding to the investigational products) will be generated. Through the packaging, the label for the investigational product kit will contain only the kit number. Investigators can dispense or administer the investigational products to the patients based on the kit number without knowing the actual contents and the treatment assignments.

There is no need to have separate roles for site monitoring (ie, unblinded monitor and blinded monitor). The same monitor can cover the study activities and the pharmacy/drug accountability.

This approach can also be used for pills (non-biological products). It is especially useful when the investigational products are dispensed to the patients for their self-administration.  

A couple of examples for using this approach are listed below:
“Randomization was to be blocked by study site, based on a SAS-generated code. Treatment assignment was made through a call to a centralized interactive voice response system for a drug kit number. Subjects were considered randomized upon verbal assignment of kit number.”
“Patients were randomly assigned to 1 of 3 groups of GXR treatment (2, 3, or 4 mg/day) or placebo, in a 1:1:1:1 ratio. Matching GXR and placebo tablets were provided to patients in the form of weekly prepackaged individual study drug kits, identical in appearance, according to the randomization schedule. Every morning during the double-blind treatment period, patients took a total of 4 tablets, without regard to meals. Patients who completed the screening and washout periods were assigned to the treatment group of the next available drug kit in ascending order of the drug kit number (or randomization number), which was recorded on the case report form.”