Showing posts with label composite strategy. Show all posts

Sunday, June 08, 2025

Composite Strategy for Intercurrent Event and the Use of Trimmed Means in Clinical Trial Data Analyses

When composite strategy is used to handle the intercurrent event (ICE), specially the terminal event such as death, the occurrence of the ICE is integrated into the endpoint definition, often by assigning a specific value to participants who experience the event.

In ICH E9-R1 "Addendum on Estimands and Sensitivity Analysis in Clinical Trials" training material, about the composite strategy to handle the intercurrent event, trimmed mean is mentioned to be an approach in handling the intercurrent event.


A trimmed mean may also be called truncated mean and is the arithmetic mean of data values after a certain number or proportion of the highest and/or lowest data values have been discarded. The data values to be discarded can be one-sided or two-sided. A trimmed mean can be defined as a robust average computed by discarding a specified fraction of the lowest and highest observations and averaging the remainder. In effect, it “trims” the tails of the data, reducing the influence of outliers. For example, a 50% trimmed mean discards the bottom 25% and top 25% of values, averaging the middle 50% In general, an alpha‑trimmed mean removes the lowest and highest alpha/2 fraction of data (where alpha is expressed as a percentage of the total).

After trimming, the mean of the remaining values is computed by the usual arithmetic formula. In practical use, common trims range from 5–20% per tail (e.g. alpha=10%-40% total) in robust estimation, though some clinical examples have trimmed up to 50%. By removing extreme observations, trimmed means downweight outliers and model the assumption that missing or dropout outcomes are worse than any observed values.

Advantages of Trimmed Means in Handling Outliers and Skewed Data

Trimmed means are recognized as robust estimators of central tendency, demonstrating less sensitivity to deviations from assumed models or distributions, such as the presence of outliers or non-normality, when compared to classical methods like the sample mean. This robustness translates into more stable and reliable results under challenging data conditions.

For asymmetric distributions, where variability is more pronounced on one side, trimmed means can provide a superior estimation of the location of the main body of observations. By removing extreme values, they offer a more robust estimate of the central value and are less influenced by skewed data distributions. Furthermore, the standard error of the trimmed mean is less susceptible to the effects of outliers and asymmetry than that of the traditional mean, which can lead to increased statistical power for tests employing trimmed means.

The advantages of trimmed means extend beyond mere statistical robustness; they enable a more clinically meaningful interpretation of treatment effects, particularly in heterogeneous patient populations or when extreme outcomes (e.g., severe adverse events, rapid disease progression) might otherwise obscure the true effect in the majority of patients. This aligns with the need for statistical methods that accurately reflect real-world clinical practice and patient experience. If extreme values arise from factors not directly related to the treatment's intended effect on the typical patient—such as rare severe adverse events or non-adherence driven by external circumstances—then their removal allows for a clearer assessment of the treatment's impact on the majority. Conversely, if extreme values are an inherent part of the treatment effect, such as severe lack of efficacy leading to patient dropout, the

trimmed mean can define an estimand for the subpopulation that did not experience these extreme negative outcomes. Both scenarios offer a more focused and potentially more interpretable clinical picture.

It is important to acknowledge the inherent trade-off between robustness and efficiency: more robust methods, including trimmed means, may sacrifice some efficiency (precision or variability) compared to optimal methods under ideal statistical assumptions. The selection of a method ultimately depends on the nature of the data and the specific goals of the analysis.

Comparison with Traditional Measures of Central Tendency (Mean, Median)

The choice among the mean, median, and trimmed mean is not merely a statistical decision but reflects a fundamental determination about the target estimand and the specific clinical question being addressed.

● Mean: The traditional arithmetic mean calculates the average of all values in a dataset. It is highly sensitive to extreme values, which can significantly distort the measure of central tendency and lead to a less representative average, especially in the presence of outliers or skewed distributions.

● Median: The median represents the middle value in an ordered dataset and is highly resistant to the influence of extreme values.3 Conceptually, the median can be viewed as an extreme form of a trimmed mean, where all but one or two central observations are effectively removed. While both the trimmed mean and the median reduce the impact of outliers, the median is generally considered more robust in certain contexts due to its reliance solely on rank order.

The trimmed mean strikes a balance between these two traditional measures. It retains more information from the dataset than the median, which discards a significant portion of the data, while simultaneously offering greater robustness to outliers than the arithmetic mean.3 This allows for a nuanced definition of "average effect" that acknowledges the presence of extreme outcomes without being unduly influenced by them (like the raw mean) or implicitly discarding them entirely (like the median). This highlights the importance of defining the estimand before selecting the statistical method, a principle strongly emphasized by ICH E9(R1).

Regulatory Context and Trial Examples

Trimmed means have been discussed in statistical literature and regulatory settings as a way to handle dropout or intercurrent events. Permutt and Li (FDA biostatisticians) first proposed using trimmed means for “symptom trials” with dropout, treating each dropout as a complete (nonnumeric) observation ranked as the worst outcome. Under this approach, all subjects who discontinue before the endpoint are implicitly assigned the worst possible values and then an equal percentage are trimmed from each arm. In effect, trimming favors treatments with fewer dropouts, since “having more completers is a beneficial effect of the drug”.

Notably, trimmed means correspond to a composite estimand in the ICH E9(R1) framework: one can assign intercurrent events (e.g. dropouts) a worst-case value and then summarize the outcome distribution by a median or trimmed mean. For instance, the ICH E9 addendum training materials explicitly cite trimmed means (alongside medians) as summary measures under a composite strategy when dropouts are scored as extreme unfavourable outcomes. A recent FDA review of glaucoma drug Rocklatan (netarsudil/latanoprost) illustrates this: the statistical reviewer computed an “adaptive trimmed mean” IOP reduction by coding patients who withdrew for lack of efficacy or adverse events as worst outcomes. The reviewer noted this analysis aligns with the composite strategy in ICH E9(R1) and can reinforce the main intent-to-treat result. 

However, we found no FDA-approved trial in which a trimmed mean was the pre‑specified primary endpoint analysis. In all examples, trimmed means have been used as sensitivity or supportive analyses rather than the main test. For example, in a uterine fibroid drug application (NDA 214846), a trimmed‐mean analysis of menstrual blood loss was reported: the trimmed mean in each arm used the 50% best-performing patients, reflecting a 50% trim. Similarly, an ophthalmology (geographic atrophy) trial review (NDA 217171) applied trimmed‐mean + multiple imputation as a sensitivity: certain dropouts were “excluded (trimmed)” in the reviewer’s analysis. In each case, the trimmed mean analysis “assumes missing data as ‘bad outcomes’” (i.e. MNAR). These examples underscore that trimmed means appear in regulatory documents as robust or conservative analyses (often labeled “completer” or MNAR analyses) rather than as the primary efficacy metric.

Key examples:

  • Glaucoma (Rocklatan NDA 208259): Reviewer performed an adaptive trimmed mean IOP analysis, excluding patients who withdrew for lack of effect and assigning worst values (citing Permutt & Li as method).

  • Uterine fibroids (NDA 214846): Primary efficacy (menstrual blood loss) was also examined by trimmed means (50% trim) as sensitivity. The FDA report notes the trimmed‐mean is based on the “top 50% best performers in each arm”.

  • Geographic atrophy (NDA 217171): A trimmed-mean + MI analysis was done by the reviewer; dropouts due to adverse events or lack of efficacy were “excluded (trimmed)” from one scenario.

These applications align with recent methodological studies showing trimmed means estimate a unique estimand: essentially, the mean outcome in the subpopulation of patients who would have remained on treatment. This estimand privileges treatments that prevent dropout, but it relies on the strong assumption that every dropout truly has an “unfavourable” outcome. As Wang et al. note, “the trimmed mean estimates a unique estimand” and its validity “hinges on the reasonableness of its assumptions: dropout is an equally bad outcome in all patients”. Ocampo et al. similarly emphasize that trimmed means work well when discontinuation is strongly associated with poor outcome, but give biased estimates if data are actually missing at random.

Calculation and Assumptions

Formula: To calculate an alpha‑trimmed mean, one typically sorts the data and discards a proportion alpha/2 from each end. For example, the 50% trimmed mean drops the lowest 25% and highest 25% of values, averaging the middle 50%. In general, if alpha (0–1) is the total fraction trimmed, remove the lowest alpha/2 and highest alpha/2 observations, then compute the mean of the remaining values. (The interquartile mean is the special case alpha=0.5.) Typical choices of alpha are guided by robustness needs: small trims (e.g. alpha=0.1 for 5% each tail) mildly reduce outlier influence, while large trims (up to 0.5) exclude half the data.

Statistical assumptions: Trimmed‐mean analyses assume that any trimmed/missing values are in fact the worst outcomes. In the dropout context, this treats early withdrawal as if the patient’s true result were extremely poor. As Ocampo et al. explain, the trimmed mean approach “sets missing values as the worst observed outcome and then trims away a fraction of the distribution”. Under this MNAR assumption, the trimmed mean can provide an unbiased estimate of the treatment effect (on the subpopulation that remains). However, if outcomes are actually missing at random (MAR) without relation to extreme values, trimmed means will be biased. In simulations, trimmed means were found to fail under MAR (because the assumption of trimming “bad” outcomes is then invalid).

Interpretation: Because the trimmed mean ignores equal fractions from each arm, it essentially compares the upper quantiles of the outcome distribution. Clinically, it reflects the mean of the best-performing subset of patients. This is why Permutt and Li emphasize that their method makes no assumptions beyond randomization: it is a nonparametric “exact” test for efficacy that includes all randomized subjects (by ranking dropouts worst). Regulators caution that the trimmed-mean estimand differs from a standard ITT mean; it answers the question, “What is the mean outcome among patients who would have remained in the trial?”.

SAS Implementation Example

Trimmed means can be computed in SAS using procedures like PROC UNIVARIATE or PROC MEANS. For instance, PROC UNIVARIATE supports a trimmed= option. The snippet below computes a 10% trimmed mean (i.e. removes 10% from each tail) of a variable Y and captures the result via ODS:


/* Example: Compute a 20% trimmed mean (10% each tail) for outcome Y */ ods output TrimmedMeans=TrimmedStats; proc univariate data=trial_data trimmed=0.10; var Y; run; proc print data=TrimmedStats noobs; title "Trimmed Mean of Y"; run;

Alternatively, PROC MEANS (SAS 9.4+) also supports trimmed means. For example:

/* Using PROC MEANS with OUTPUT to get trimmed mean */
proc means data=trial_data noprint trimmed=0.10; var Y; output out=Stats (drop=_TYPE_ _FREQ_) trimmed=Y_trimmed; run; proc print data=Stats noobs; title "Trimmed Mean of Y via PROC MEANS"; run;

These code examples illustrate that one can easily obtain trimmed‐mean estimates in SAS by specifying the trimmed percentage (e.g. 0.10 for 10%) and directing the procedure output to a dataset for further use. (In practice, one would adjust trimmed= according to the planned trim proportion.)

Using Google Gemini, a comprehensive report on using trimmed means in clinical trials was generated and can be accessed here. 

Sunday, July 28, 2024

Five most frequently used strategies for handling intercurrent events

The original ICH E9 guideline, titled "Statistical Principles for Clinical Trials," was established in 1992. An updated version, ICH E9 (R1), was released in November 2019 and is known as the "Addendum on Estimands and Sensitivity Analysis in Clinical Trials to the Guideline on Statistical Principles for Clinical Trials." Since its publication, regulatory agencies have gradually adopted the ICH E9 (R1) guidelines. As a result, regulatory reviewers commonly require sponsors to define estimands, identify intercurrent events, and propose strategies for handling these events in the study protocol and/or the statistical analysis plan (SAP).

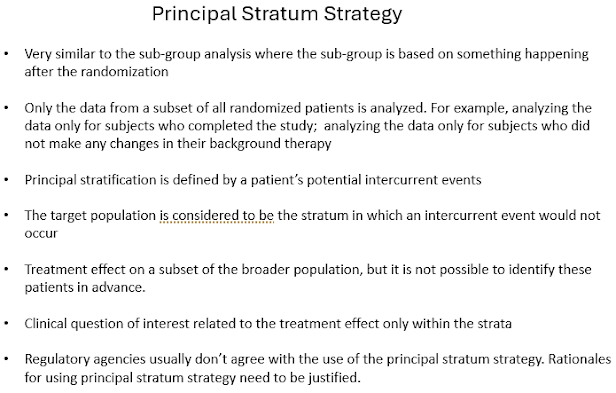
The ICH E9 (R1) guideline, along with its accompanying training slides, provides detailed information on the concepts of estimands, intercurrent events, and various strategies for managing intercurrent events. The five most commonly used strategies for handling intercurrent events are: treatment policy, Composite, hypothetical, while on treatment, and principal stratum.


Below are five slides discussing the five most commonly used strategies:


Monday, January 15, 2024

Terminal events as intercurrent events in clinical trials

ICH E9 "Addendum on Estimands and Sensitivity Analysis in Clinical Trials to the Guideline on Statistical Principles for Clinical Trials" contained discussions about intercurrent events and strategies for handling intercurrent events. Intercurrent events were defined as: 

Events occurring after treatment initiation that affect either the interpretation or the existence of the measurements associated with the clinical question of interest. It is necessary to address intercurrent events when describing the clinical question of interest in order to precisely define the treatment effect that is to be estimated.

The terminal events are one kind of intercurrent event. ICH E9 Addendum did not provide the formal definition for 'terminal events', but gave examples of the terminal events: 

Examples of intercurrent events that would affect the existence of the measurements include terminal events such as death and leg amputation (when assessing symptoms of diabetic foot ulcers), when these events are not part of the variable itself.

In a paper by Siegel et al "The role of occlusion: potential extension of the ICH E9 (R1) Addendum on Estimands and Sensitivity Analysis for Time-to-Event oncology studies", the terminal events were described as the following: 

The estimands guidance also introduces the concept of a terminal event. Terminal events prevent the possibility of subsequent measurement. "For terminal events such as death, the variable cannot be measured after the intercurrent event, but neither should these data generally be regarded as missing." There are two examples given in the guidance, death and leg amputation. These examples clarify that terminal events physically prevent subsequent measurement, for any estimand in any study. 

Terminality is an objective property of an event which renders further observation physically impossible. If an event is terminal, it is impossible to devise a study that can look beyond it. Indeed there is no meaningful clinical question regarding the treatment effect that manifests after a terminal event. 

Terminal events can be defined as events that make the outcome measures impossible and the events are not part of the outcome such as death and ankle amputation in a trial assessing ankle function). Sometimes, the outcome measure after the terminal events may still be possible, but the measures after the terminal events are not meaningful. For example, in clinical trials of pulmonary diseases with spirometry measure as the primary outcome, lung transplantation will be a terminal event. After the lung transplantation, the spirometry measure can still be performed, but the spirometry measure is a reflection of the transplanted lungs, not the intended measure of the clinical trial endpoint. 

Terminal events should be separated as fatal (death, mortality) and non-fatal terminal events (may be called 'terminal events excluding mortality'). While they are all considered intercurrent events, the strategies for handling the fatal and non-fatal terminal events need to be different. 

Strategies for Handling the Fatal Terminal Events

Treatment policy strategy can not be used for handling fatal terminal events (death events). ICH E9 Addendum mentioned the following: 

In general, the treatment policy strategy cannot be implemented for intercurrent events that are terminal events, since values for the variable after the intercurrent event do not exist. For example, an estimand based on this strategy cannot be constructed with respect to a variable that cannot be measured due to death.

Composite strategies (or composite variable strategies) are particularly useful for handling fatal terminal events (deaths). The occurrence of the fatal terminal intercurrent event is informative about the effect of the treatment and so it is incorporated in the endpoint. In practice, the outcomes after the fatal terminal intercurrent event can not be observed, but need to be assumed to have the worst values. 

With the composite strategy, the terminal intercurrent events will be assigned a failed value. A failed value may be:

    • Worse possible measure (for example, 0 for 6MWD and 0 for FEV1 or FVC measures)
    • Worst observed value across all subjects at the endpoint visit
    • Trimmed means (trimmed means and quantiles were mentioned in ICH E9 addendum training materials)
    • The worst change (from baseline) of all subjects plus a random error. The error can be randomly drawn from a normal distribution with a mean of 0 and a variance equal to the residual variance estimated from the mixed model for all observed values of change from baseline
In FDA's guidance, "Amyotrophic Lateral Sclerosis: Developing Drugs for Treatment Guidance for Industry", deaths were integrated into the functional measure by the ALS Functional Rating Scale-Revised (ALSFRS-R). The guidance said:
Functional endpoints can be confounded by loss of data because of patient deaths. To address this, FDA recommends sponsors use an analysis method that combines survival and function into a single overall measure, such as the joint rank test.
In pivotal clinical trials in ALS, the joint rank test is almost the default method for analyzing the primary efficacy endpoint of the ALSFRS-R. The Joint Rank statistic ranks study participants in each treatment group, first by survival and then by ALSFRS-R score. The Joint Rank can increase power relative to analysis of either ALSFRS-R or survival analysis alone in some circumstances, for example when mortality rates are high 

Joint Rank test was described and used in the NEJM paper by Miller et al "Trial of Antisense Oligonucleotide Tofersen for SOD1 ALS".

Strategies for Handling the Non-Fatal Terminal Events

It is acceptable to use hypothetical strategy to handle the non-fatal terminal intercurrent events. "Hypothetical strategies: A scenario is envisaged in which the intercurrent event would not occur: the value of the variable to reflect the clinical question of interest is the value which the variable would have taken in the hypothetical scenario defined." 

The value of the variable to reflect the clinical question of interest is the value which the variable would have taken in the hypothetical scenario defined. The value to be considered would have been the one collected if patients had not had the non-fatal terminal event. Outcomes after the non-fatal terminal events do not need to be measured. If the outcomes after the non-fatal terminal events are measured (for example, the spirometry measure after lung transplantation), the measures can be disregarded and not used in the analyses. The outcomes after the non-fatal terminal events cannot be observed, can be left as missing values, and usually need to be implicitly or explicitly predicted/imputed.